


Table des matières
- What Is Sampling Bias?
- Why Sampling Bias Matters for Businesses in 2026
- How Sampling Bias Develops Across the Research Process
- Best Practices for Preventing Biased Research Samples
- How AI Is Changing Sampling Bias in 2026
- Tools & Resources for Sampling Bias
- Conclusion: Build Representative Evidence Before Scaling Decisions
- Questions fréquemment posées
Understanding Sampling Bias: Causes and Solutions
A million survey responses can confidently point your business in the wrong direction. When recruitment systematically excludes relevant customers, additional responses reinforce the distortion rather than correct it. Sampling bias turns persuasive dashboards into unreliable decision tools.
For teams exploring AI-powered marketing through H-in-Q.com, this distinction matters: automated analysis cannot repair an audience that research never reached. Better evidence starts with recruitment, not presentation.
In this guide, you’ll discover how biased samples develop, how to diagnose their business impact, and which interventions improve research credibility.
What Is Sampling Bias?
Sampling bias is systematic distortion in research estimates caused by a sample-selection or participation process that fails to represent the target population adequately. It arises when inclusion is associated with characteristics relevant to the research question, making findings consistently different from those expected across the intended population.
Representation is question-specific. A sample matching population age distributions can still misrepresent purchasing behavior if recruitment disproportionately attracts frequent buyers.
Unlike random sampling error, this distortion does not automatically shrink with sample size. Researchers must examine who enters the study, who remains absent, and whether those differences affect outcomes.
Why Sampling Bias Matters for Businesses in 2026
Research increasingly feeds automated segmentation, forecasting, and campaign decisions. Consequently, an unrepresentative survey can influence thousands of downstream actions before anyone questions its assumptions.
Consider precision: under simple random sampling assumptions, 1,000 responses produce an approximate 95% margin of error of ±3.1 percentage points for a proportion near 50%, before finite-population correction. That calculation does not cover systematic selection problems.
A satisfaction survey excluding churned customers therefore remains misleading despite narrow confidence intervals. The American Association for Public Opinion Research’s best practices emphasize sound design, appropriate sampling, and transparent reporting.
Business consequences include overestimated demand, underestimated churn, and wasted acquisition spending. Precision describes uncertainty within a design; it does not prove that the design represents your market.
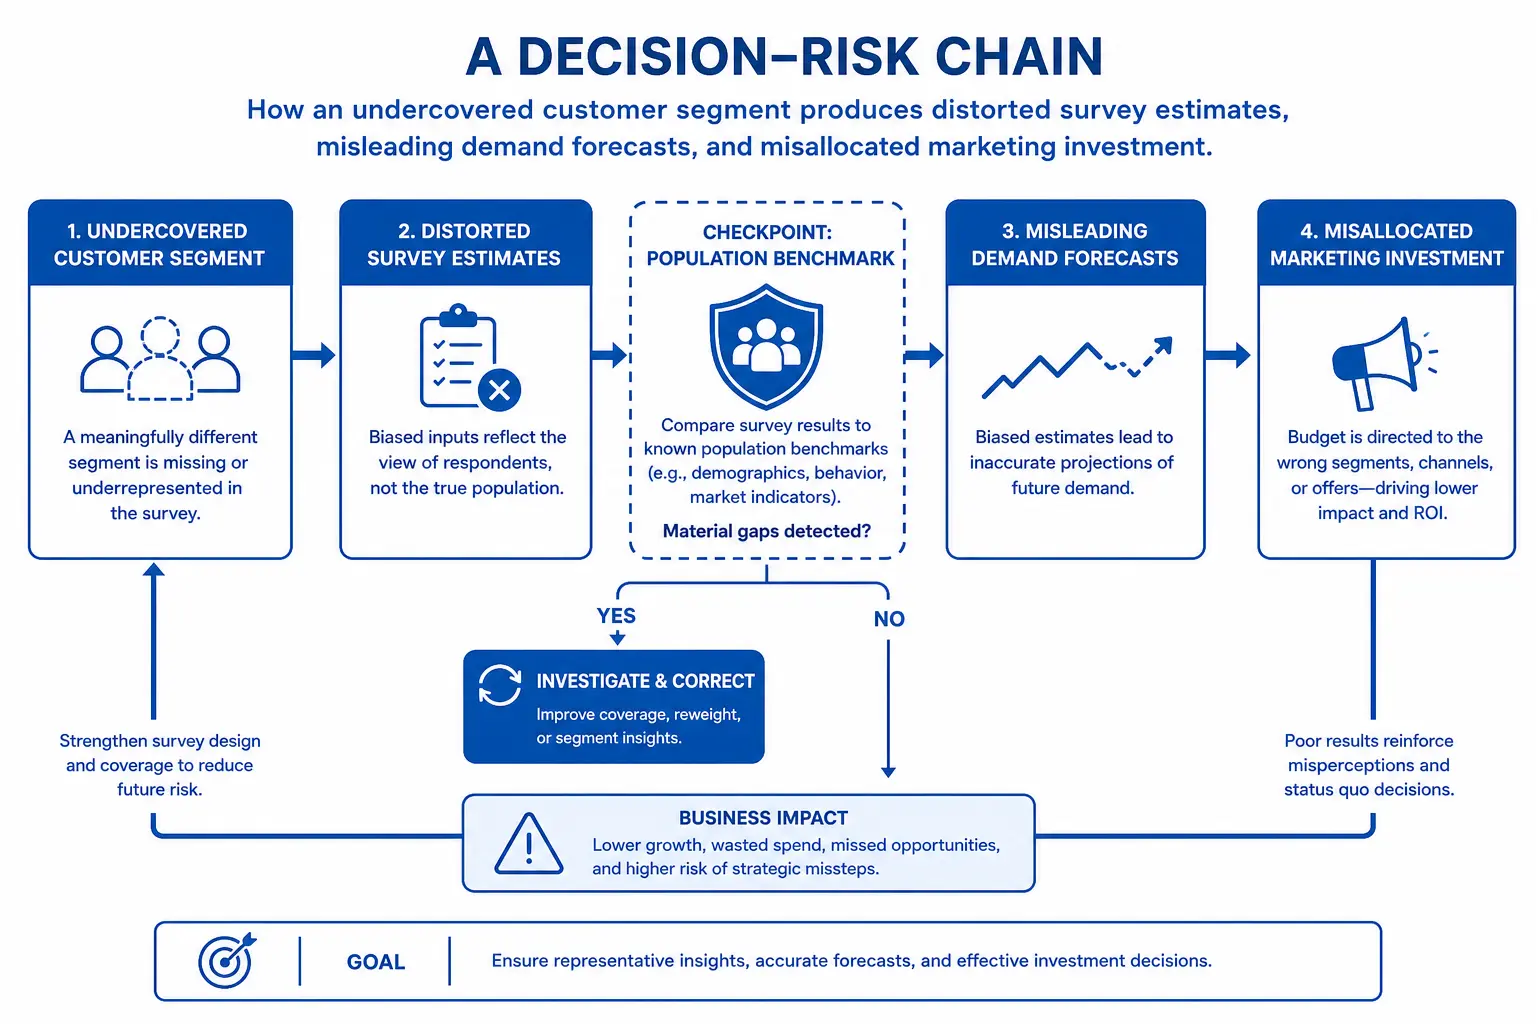
How Sampling Bias Develops Across the Research Process
Coverage and recruitment determine who gets considered
The sampling frame is the operational list or mechanism used to reach eligible participants. Customer databases exclude prospects; app notifications exclude inactive users; daytime telephone recruitment disadvantages unavailable workers.
These gaps matter when excluded people differ on the outcome. Geographic undercoverage, for example, distorts delivery preferences when service availability varies by location.
Participation determines whose experience becomes visible
Even eligible invitees participate at different rates. Highly engaged customers often respond more readily, while frustrated customers sometimes overparticipate in complaint-focused studies.
Nonresponse becomes bias when participation relates to the measured outcome after accounting for relevant adjustments. A low response rate is a warning signal, not a direct measurement of distortion.
Formally, the respondent mean minus the population mean equals Cov(Y,R)/P(R), where Y is the outcome and R indicates participation. The relationship between participation and the outcome drives the difference.
Adjustments depend on information, not optimism
Weighting increases or decreases respondents’ influence to match benchmarks. It works best when adjustment variables explain both participation and the outcome.
If every respondent is an active subscriber, demographic weighting cannot recover former subscribers’ experiences. Likewise, extreme weights increase variance. Report effective sample size alongside nominal sample size to expose lost precision.
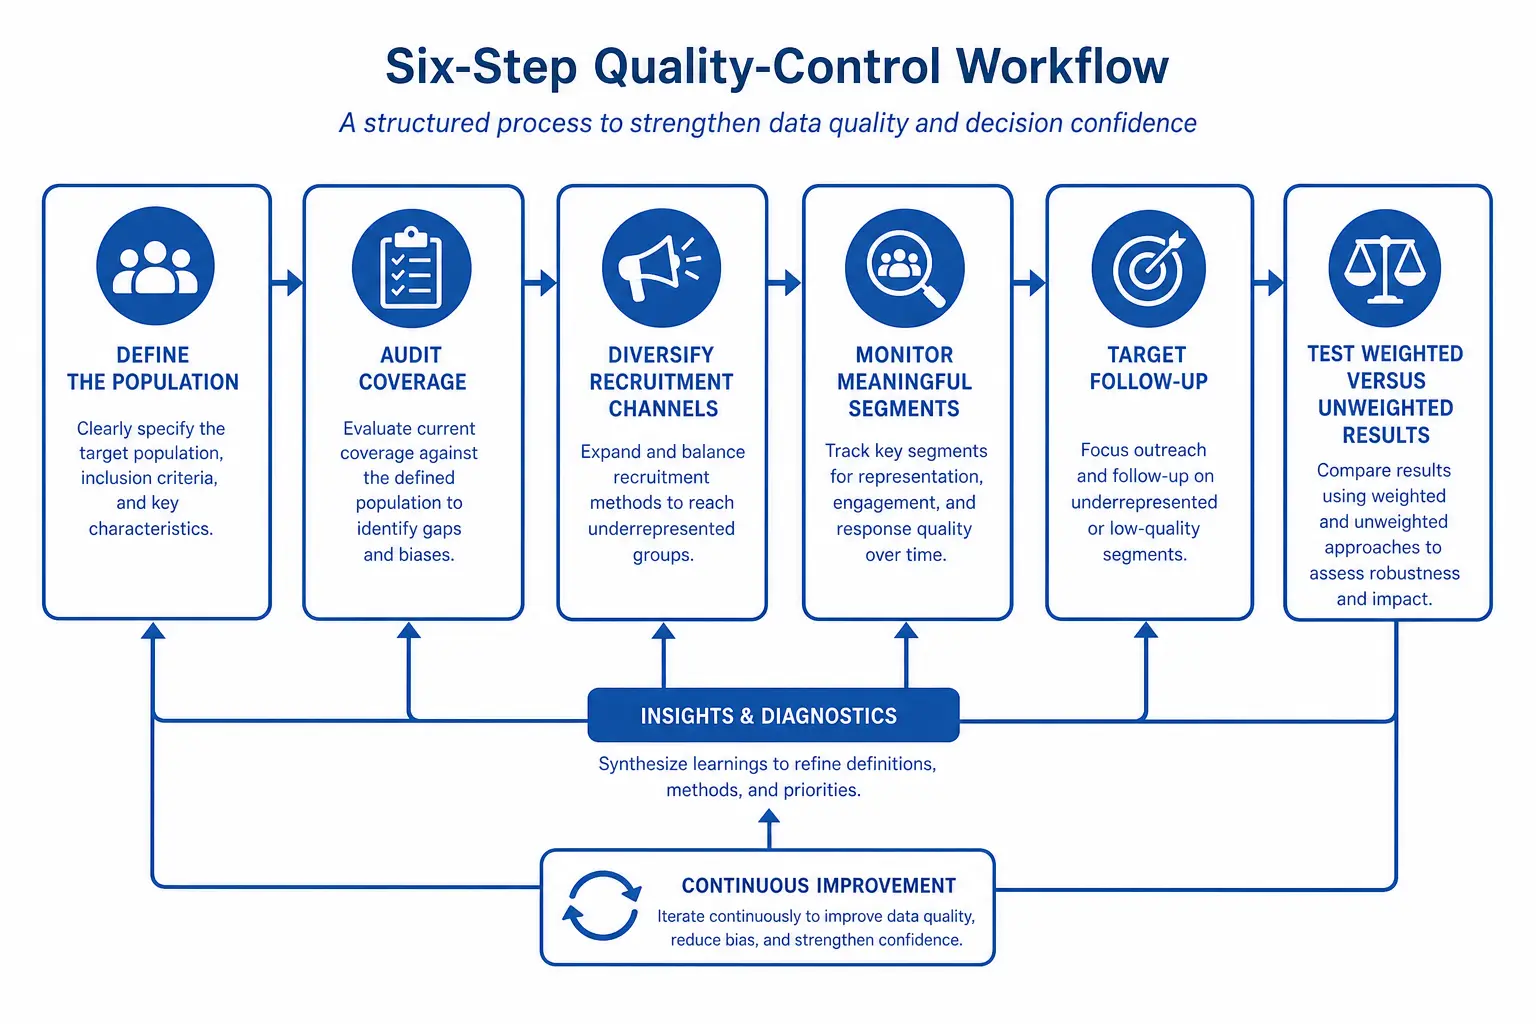
Best Practices for Preventing Biased Research Samples
- Define the population. Specify eligibility, geography, purchase status, and the decision the findings must support.
- Audit coverage. Compare recruitment sources against known customer or population counts before launching.
- Diversify recruitment. Combine appropriate channels and check for duplicates or channel-specific response patterns.
- Monitor meaningful segments. Track tenure, usage, or purchase frequency alongside demographics when relevant.
- Pause rather than overcollect. Counterintuitively, stopping an overfilled segment and pursuing missing groups is better than maximizing responses.
- Test sensitivity. Compare unweighted, weighted, and alternative adjustment results. Investigate conclusions that change materially.
For targeted follow-up, vary contact times, offer accessible formats, and simplify participation. Document recruitment changes so analysts can distinguish improved coverage from changing measurement conditions.
How AI Is Changing Sampling Bias in 2026
AI supports earlier detection by comparing incoming respondents with approved benchmarks and flagging segment imbalances. Automated workflows can then queue targeted invitations for human approval.
Language models also classify recruitment complaints and summarize participation barriers. However, their classifications require validation against human-reviewed examples, especially across languages and accessibility needs.
Predictive response models help prioritize follow-up, but optimization targets matter. Maximizing completed surveys alone favors easy-to-reach participants and reinforces existing imbalances.
Synthetic respondents are not evidence that missing customers were represented. Treat generated responses as exploratory material, not substitutes for observed population data. Keep benchmark selection, adjustment decisions, and audit trails under accountable human control.
Tools & Resources for Sampling Bias
- R: Free statistical software for reproducible analysis. Its survey package supports complex designs, weighting, and design-aware uncertainty estimates.
- Qualtrics: Commercial survey software for recruitment management and response monitoring. Quotas require defensible targets; filling them does not guarantee representativeness.
- U.S. Census Bureau data: Free population benchmarks. Match geography, eligibility, definitions, and reference periods before calibrating survey weights.
- AAPOR: Professional standards and methodological resources for evaluating recruitment, reporting response outcomes, and communicating research limitations.
Conclusion: Build Representative Evidence Before Scaling Decisions
Controlling sampling bias starts before the first invitation. Define the population, examine recruitment coverage, and investigate participation differences that relate to your business question.
Then use weighting cautiously and test whether alternative assumptions change the decision. AI accelerates monitoring and follow-up, but neither automation nor larger samples substitutes for credible inclusion.
For support connecting trustworthy research with AI-powered business workflows, explore H-in-Q.com’s AI solutions. The strongest research programs will build representativeness checks into decisions before automation scales their consequences.
Questions fréquemment posées
What is sampling bias in market research?
Sampling bias is systematic distortion caused by a sample that does not adequately represent its target population for the research question. It occurs when inclusion or participation patterns favor particular groups. The resulting findings misstate customer preferences, demand, or behavior when those groups differ meaningfully.
What is the difference between sampling bias and sampling error?
Sampling bias is systematic distortion, while sampling error is random variation between a sample estimate and its population value. Increasing a properly selected sample generally reduces sampling error. It does not correct systematic exclusion, unequal participation, or a recruitment process that consistently favors certain customers.
Does increasing sample size reduce sampling bias?
Increasing sample size does not inherently reduce sampling bias because the recruitment mechanism can remain unchanged. Collecting more responses from loyal customers still excludes dissatisfied former customers. Fix coverage and participation problems first, then increase the sample to improve precision within the corrected research design.
Can weighting fix a biased survey sample?
Weighting can reduce bias when reliable population benchmarks and relevant adjustment variables are available. It cannot guarantee correction for missing characteristics or entirely absent groups. Researchers should inspect extreme weights, calculate effective sample size, and compare conclusions across reasonable weighting specifications before reporting adjusted estimates.
How do you detect nonresponse bias?
Detect nonresponse bias by comparing respondents with eligible nonrespondents using available information related to the research outcome. Relevant variables include spending, tenure, geography, and service history. Targeted follow-up with initially unresponsive groups provides additional evidence. A low response rate alone does not establish the amount of bias.
Can AI eliminate sampling bias?
AI cannot eliminate sampling bias because its analysis depends on observed data, valid benchmarks, and defensible assumptions. It can flag imbalances, prioritize follow-up, and compare adjustment strategies. Human researchers must still define the population, validate recruitment coverage, and determine whether missing groups undermine the intended conclusions.

 English
 Français
 Español