


Companies with the highest Net Promoter Score in their industry grow at more than twice the rate of their competitors, yet most businesses calculate NPS once, glance at the number, and never act on what the underlying segments are actually telling them. NPS is a single-question metric, but the score itself is only half the value; the real insight lives in what you do with your Promoters, Passives, and Detractors afterward. Get the calculation wrong, and you’re reporting a meaningless number to leadership. Get the follow-up wrong, and you’re sitting on a list of at-risk customers you never called. This guide breaks down the exact NPS formula, walks through a full worked example, gives you 2026 industry benchmarks, and shows you what to actually do with each customer segment. At H-in-Q, we built our free NPS Calculator because too many teams were pulling this number from a manually built spreadsheet formula that broke the moment someone added a new response column. In this guide, you’ll calculate your score correctly and know exactly what to do with it.
Direct Answer: Net Promoter Score (NPS) measures customer loyalty with one question — “How likely are you to recommend us?” — scored from -100 to +100 by subtracting the percentage of Detractors (0-6) from the percentage of Promoters (9-10). Any score above 0 is positive, 30-49 is good, 50-69 is great, and 70+ is world-class, though the right benchmark always depends on your specific industry.
What Is NPS: The Definition That Actually Matters
Net Promoter Score (NPS) measures customer loyalty using one question: “How likely are you to recommend us to a friend or colleague?” on a 0-10 scale. Responses split into three groups, Promoters (9-10), loyal customers who actively drive referral growth; Passives (7-8), satisfied but unenthusiastic customers vulnerable to competitors; and Detractors (0-6), unhappy customers at risk of churning and spreading negative word-of-mouth. The final score is calculated as % Promoters − % Detractors, ranging from -100 to +100.
Developed by Fred Reichheld and Bain & Company in 2003, NPS has become the most widely adopted loyalty metric globally because it correlates directly with revenue growth. The median NPS across all industries in 2025 was 42; a useful reference point, but industry context matters more than any universal number. This is also where AI-powered analysis adds real value: instead of just reporting the score, AI-driven sentiment analysis on open-ended NPS follow-up comments can surface why customers scored the way they did, turning a single number into an actionable list of fixes.
Why NPS Matters for Businesses in 2026
The business case for NPS isn’t abstract but tied directly to growth rate. Bain & Company’s research found that companies with the highest NPS in their industry grow at more than twice the rate of their competitors, and Promoters carry a customer lifetime value that’s commonly cited at 3-8x higher than Detractors. That gap alone justifies treating NPS as a growth metric, not just a satisfaction survey.
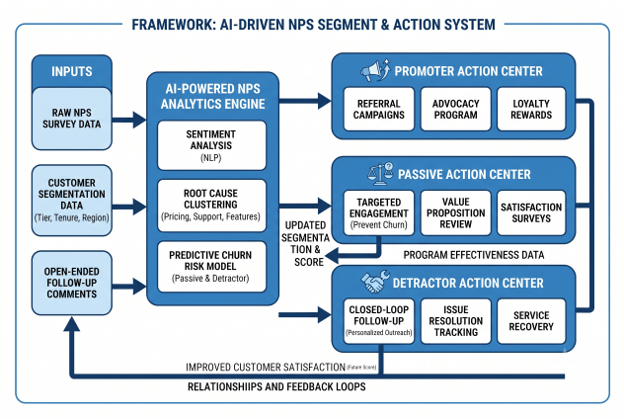
The cost of ignoring NPS segmentation shows up in churn you never saw coming. A Passive customer isn’t a safe customer; they’re one bad experience away from becoming a Detractor, and most businesses never follow up with this group specifically. Detractors who are contacted and their issue resolved convert into some of a business’s most loyal customers, but only if the follow-up actually happens, the score itself changes nothing without action behind it.
How to Calculate Your NPS Score: Step-by-Step
- Ask the single NPS question. “On a scale of 0-10, how likely are you to recommend [company name] to a friend or colleague?” Keep the wording exact; small variations affect benchmark comparability.
- Add one open-ended follow-up question. “What’s the main reason for your score?” This single follow-up is what turns NPS from a number into a prioritized action list.
- Categorize every response. Promoters score 9-10, Passives score 7-8, Detractors score 0-6. Every response must fall into exactly one category; there’s no partial credit.
- Calculate each group’s percentage. Divide each category’s count by total responses, multiplied by 100. Example: 60 Promoters, 20 Passives, 20 Detractors out of 100 total responses = 60% Promoters, 20% Passives, 20% Detractors.
- Apply the NPS formula. NPS = % Promoters − % Detractors. Using the example above: 60% − 20% = NPS of 40. Passives are counted in your total response count but never appear in the subtraction itself; they’re tracked separately as an at-risk segment.
- Confirm you have enough responses for a valid score. Most researchers recommend a minimum of 30-50 responses for a meaningful NPS reading; fewer than that, and small response swings can move your score dramatically.
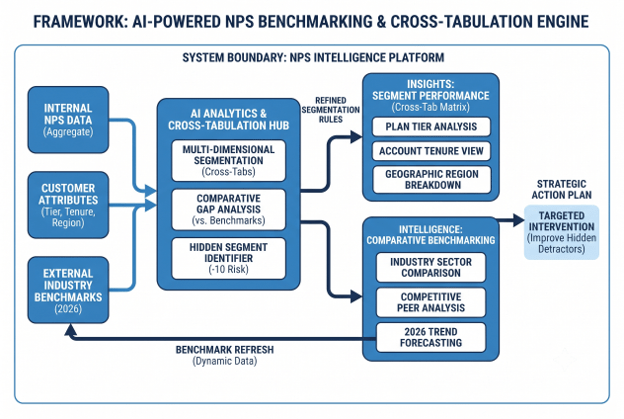
- Segment the result by customer type. Break the same calculation down by plan tier, account age, or region. An aggregate NPS of 40 can hide a segment sitting at -10 that needs immediate attention.
- Benchmark against your specific industry, not a universal number. A score of 30 is exceptional in some sectors and merely average in others, always compare against same-industry data before deciding your score needs work.
NPS Industry Benchmarks (2026)
| Industry | Typical NPS Range | Interpretation |
|---|---|---|
| Grocery / retail | ~30 | Solid, competitive baseline |
| Video streaming | ~29 | Average for the category |
| SaaS / B2B software | 30–40 | Good; 40+ is strong differentiation |
| Consumer payments | Below 0 | Category-wide friction, low bar to clear |
| All industries (median) | ~42 | General 2025 reference point |
Benchmark figures sourced from Qualtrics XM Institute industry research.
Absolute scoring guide, regardless of industry: below 0 signals more Detractors than Promoters and requires immediate attention; 0-29 is positive but has clear room to grow; 30-49 is good; 50-69 is great; 70+ is world-class and rare.
NPS Best Practices: What Works, What Wastes Time
| Practice | Why It Works |
|---|---|
| Always pair NPS with an open-ended follow-up | Turns a number into a specific, actionable reason list |
| Segment by plan tier, tenure, or region | Hides-and-reveals problems an aggregate score buries |
| Close the loop with every Detractor personally | Converts a share of Detractors into some of your most loyal advocates |
| Track Passives as an at-risk group, not a “fine” group | They’re the segment most vulnerable to a single competitor offer |
| Include non-respondents thoughtfully | Silent, disengaged customers often skew more negative than reported |
| Benchmark against your specific industry | A 30 is excellent in one sector and mediocre in another |
The most common mistake teams make: treating NPS as a single quarterly report-out number instead of a live segmentation tool. The score itself doesn’t move anything; the outreach to Detractors and Passives does.
How AI Is Transforming NPS Analysis in 2026
Manually reading through hundreds of open-ended NPS comments to find patterns is exactly the kind of task AI now handles in minutes instead of days. AI-powered sentiment analysis can cluster Detractor comments by root cause; pricing, support response time, missing features, turning a wall of unstructured text into a prioritized fix list your product and support teams can act on immediately.
This matters most at scale, where a business collecting hundreds of NPS responses per quarter simply can’t manually read every comment. AI tools can also flag Passive responses trending toward Detractor language before the score itself drops, giving customer success teams a chance to intervene early. At H-in-Q, our approach combines the free NPS Calculator with AI-assisted comment analysis, so a raw NPS number turns into a specific, segmented action plan instead of a static quarterly metric nobody follows up on.
Tools & Resources for NPS Measurement
- H-in-Q NPS Calculator: free, instant, segment-ready NPS scoring.
- H-in-Q Survey Template Builder: pre-built NPS question wording and follow-up structure.
- H-in-Q Cross-Tab Generator: segment NPS results by plan tier, region, or account age.
- H-in-Q Sample Size Calculator: confirm you have enough responses for a statistically meaningful score.
FAQ
What is a good NPS score?
Any score above 0 is positive. A score of 30-49 is generally good; 50-69 is great, and 70+ is world-class, though the meaningful benchmark is always your specific industry average, not a universal number.
How do you calculate NPS from survey responses?
Categorize responses into Promoters (9-10), Passives (7-8), and Detractors (0-6), calculate each group's percentage of total responses, then subtract the Detractor percentage from the Promoter percentage.
Why don't passives count in the NPS formula?
Passives are considered neutral; they neither actively promote nor damage your brand, so they're excluded from the subtraction. They're still tracked closely because they're the segment most likely to switch to a competitor.
What is the average NPS score by industry?
The median NPS across all industries in 2025 was around 42, but individual sectors vary widely; grocery and retail hover near 30, while consumer payments has historically averaged below 0.
How many responses do you need for a valid NPS score?
Most researchers recommend a minimum of 30-50 responses for a meaningful reading. Below that threshold, a small number of new responses can swing your score dramatically and make trend tracking unreliable.
What's the difference between NPS and CSAT?
NPS measures long-term loyalty and referral likelihood with one relationship-level question, while CSAT (Customer Satisfaction) measures satisfaction with a single specific interaction. Most mature CX programs track both alongside Customer Effort Score (CES) for a complete picture.
Conclusion
NPS is deceptively simple to calculate but easy to waste if you stop at the number. Ask the single recommendation question, add one open-ended follow-up, calculate Promoters minus Detractors, and then actually act on what each segment is telling you, especially the Passives one bad experience away from leaving and the Detractors waiting to be won back. Companies with the highest NPS in their category grow at more than twice the rate of competitors, and that growth comes from the follow-up, not the score itself. Ready to calculate yours? H-in-Q’s free NPS Calculator gives you the number instantly, with segment breakdowns that turn a single quarterly metric into a real action plan.