


Introduction
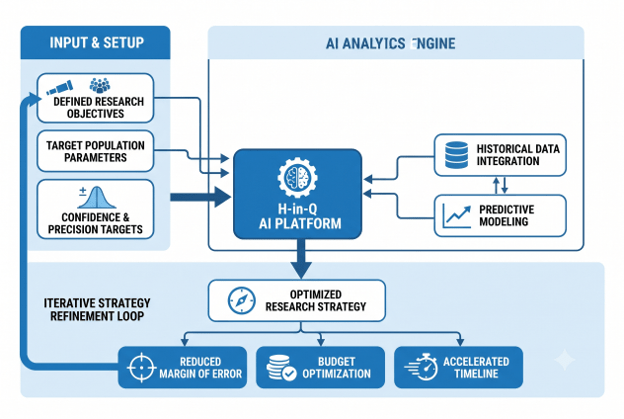
A survey of 50 customers and a survey of 500 can produce wildly different confidence in the same conclusion, and most founders guess at the number instead of calculating it. Sample size determines whether your market research results reflect reality or just the loudest 30 people who answered your email. Get it wrong, and you either waste budget oversurveying a niche audience, or you make a six-figure product decision on data with a 15% margin of error. This guide breaks down exactly how to calculate sample size for market research, walks through a real B2B example, and gives you a free calculator, so you never have to touch the formula by hand. At H-in-Q, we build AI-powered research tools precisely because most teams don’t have a statistician on staff; they need the right number in seconds, not a stats degree. In this guide, you’ll learn exactly how to size any survey correctly, avoid the most common sampling mistakes, and get a sample size in under a minute.
What Is Sample Size in Market Research?
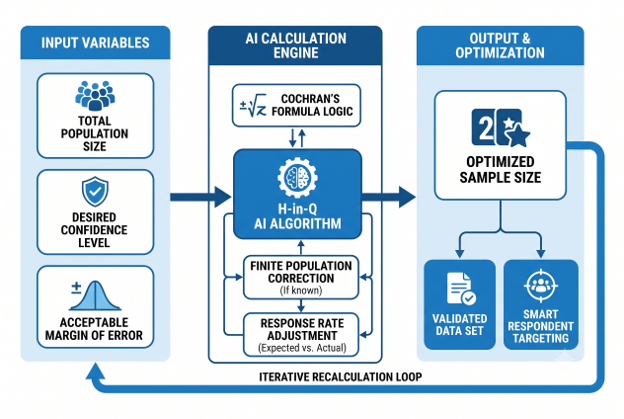
Sample size is the number of respondents you need to survey, so your results reliably represent the full population you’re studying; your customer base, your target market, or a specific segment within it. It’s calculated using three inputs: your total population size, your desired confidence level, and your acceptable margin of error. Get any one of those wrong, and the resulting number either wastes your budget or undermines your conclusions.
In market research, sample size matters because you can almost never survey everyone. A SaaS company with 40,000 users can’t realistically interview all of them before a pricing decision, but it can survey a properly sized sample and trust the result. A correctly calculated sample lets a business make a market-wide decision from a fraction of the population. This is also where AI-powered research tools add value: they don’t just calculate the number; they help you reach that sample faster through smarter respondent targeting.
Why Sample Size Matters for Businesses in 2026
Getting sample size wrong is expensive in a specific, measurable way. A commonly recommended baseline for brand tracking research is a minimum sample size of 1,000 respondents; far more than most startups budget, which is exactly why undersized studies are so common. Meanwhile, at 95% confidence with a 5% margin of error, the required sample from an unknown population is 384 respondents, while moving to 99% confidence at the same margin pushes that number up by roughly 73%.
The real-world cost of ignoring this shows up downstream. A product decision based on 40 survey responses might carry a margin of error above 15%; meaning the “62% prefer Feature A” result could actually sit anywhere from 47% to 77% in the real population. Businesses that calculate sample size properly before fielding a survey make decisions with a known, defensible error rate. Businesses that skip this step make decisions on numbers that look precise but aren’t.
How to Calculate Sample Size for Market Research: Step-by-Step
- Define your population. Your population is everyone the survey result should represent, not everyone you could theoretically reach. A B2B SaaS company researching churn risk should define its population as “active accounts in the last 90 days,” not “everyone who ever signed up.”
- Choose your confidence level. This is how sure you want to be that your sample reflects the real population. 95% is standard for most market research; 90% is acceptable for low-stakes exploratory work; 99% is reserved for high-cost decisions. Each level maps to a fixed z-score: 1.65 for 90%, 1.96 for 95%, 2.58 for 99%.
- Set your margin of error. Margin of error is the range your result could realistically deviate from the true population value. Most researchers use a margin of error between 3% and 8% at the 95% confidence level. Tighter margins (3-4%) require significantly larger samples; looser margins (7-8%) let you survey fewer people.
- Estimate response distribution (p). This is the expected split of your key answer for example; the percentage likely to say “yes” to a feature request. If you have no prior data, use 0.5. Using p = 0.5 is the safest default because it produces the largest, most conservative sample size for any given confidence and margin.
- Apply the formula. n = (Z² × p × (1-p)) / e². Plug in your chosen z-score, p, and margin of error (as a decimal). At 95% confidence, p = 0.5, and a 5% margin, this returns approximately 385.
- Apply finite population correction if needed. If your total population is known and under roughly 50,000, the raw formula overestimates what you need. The corrected sample is n = n₀ / (1 + (n₀ – 1) / N), and this correction produces sample sizes like 87 for a population of 100, 286 for a population of 500, and 400 for a population of 1,000.
- Adjust for expected response rate. If you expect a 25% response rate, divide your target sample by 0.25 to determine how many people to invite. A target of 385 completed responses at a 25% response rate means inviting roughly 1,540 people.
- Run the numbers through a calculator, not by hand. Manual calculation invites rounding errors at exactly the step where precision matters most. Use a purpose-built tool like H-in-Q’s free Sample Size Calculator to avoid formula mistakes and get a rounded, ready-to-use number instantly.
Sample Size Best Practices: What Works, What Wastes Time
| Practice | Why It Works |
| Define population before choosing sample size | Prevents the entire calculation from being built on the wrong denominator |
| Default to p = 0.5 without prior data | Produces the safest, most conservative estimate |
| Use 95% confidence for most studies | Industry standard; balances precision and feasibility |
| Oversample by expected non-response rate | Guarantees your completed count, not just your invite count |
| Treat the calculator output as a floor, not a ceiling | Feasibility and audience availability still matter |
| Recalculate per subgroup for segmented analysis | A total of 300 split across 3 sites gives only 100 per site – often too thin for site-level comparison |
The most commonly overlooked item: researchers frequently apply one sample size calculation to an entire study, then run subgroup comparisons that were never sized for statistical validity in the first place. If you plan to break results down by segment, region, or plan tier, each subgroup needs its own minimum sample, not a slice of the aggregate number.
How AI Is Transforming Sample Size Calculation in 2026
Traditional sample size calculators solve one part of the problem: the math. They don’t solve the harder part, actually reaching that many qualified respondents without blowing your timeline or budget. AI-powered research platforms now handle both ends simultaneously: calculating the statistically correct sample size, then using predictive targeting to identify which respondent pool is most likely to hit that number with a usable response rate.
This matters most for niche B2B populations, where the total addressable audience might be a few thousand decision-makers rather than millions of consumers. AI models can now estimate expected response distribution (p) from historical survey data instead of defaulting to the conservative 0.5, tightening the required sample without sacrificing accuracy. At H-in-Q, this is the exact gap our market research tools are built to close, pairing the statistical calculation with AI-assisted respondent targeting, so businesses get valid data faster, not just a number on a page.
Tools & Resources for Sample Size Calculation
- H-in-Q Sample Size Calculator: free, instant, includes finite population correction and response-rate adjustment.
- Cochran’s Formula (manual): the underlying math, useful if you need to show your work for academic or funder review.
- Margin of Error Calculator: reverse-calculates precision from an existing sample size.
- NPS Calculator: for teams sizing loyalty and retention surveys specifically.
- Survey Template Builder: pairs directly with your calculated sample size to build the actual instrument.
👉TAM SAM SOM calculator
👉Market Research Ratio Calculator
Sample size calculator – FAQ
What is a good sample size for market research?
For most consumer surveys, 385 respondents gives a 95% confidence level with a 5% margin of error. Smaller, well-defined populations (like a company's existing customer base) may need far fewer; sometimes under 300, once finite population correction is applied.
How do you calculate sample size for a survey?
Use the formula n = (Z² × p × (1-p)) / e², selecting your z-score from your confidence level, 0.5 for p if you lack prior data, and your margin of error as a decimal. Apply finite population correction if your total population is known and under roughly 50,000.
What confidence level should I use for market research?
Use 95% for the large majority of market research studies; it's the accepted industry standard. Reserve 99% for decisions where a wrong conclusion carries serious financial or reputational cost.
Does population size matter for sample size?
Yes, but only up to a point. Below roughly 20,000-50,000, a smaller population meaningfully reduces the required sample size through finite population correction. Above that threshold, additional population size barely changes the number needed.
What margin of error is acceptable in market research?
Between 3% and 8% at 95% confidence is the commonly accepted range. Board-level or high-stakes decisions should aim for the tighter end (3-4%); exploratory studies can use 7-8% to save on sample size.
Can I use a smaller sample size and still get valid results?
Yes, but the margin of error widens, meaning your results are less precise and harder to defend against scrutiny. A smaller sample is often acceptable for directional, exploratory research, not for decisions requiring statistical certainty.
Conclusion
Sample size isn’t a formality before a survey goes out; it’s the single number that determines whether your market research results are trustworthy or misleading. Getting there means defining your population honestly, choosing a defensible confidence level and margin of error, and running the actual Cochran’s formula calculation rather than guessing at a round number. Most market research lands at 95% confidence, a 5% margin of error, and roughly 385 respondents for large populations, adjusted down through finite population correction for smaller, well-defined audiences. Ready to skip the manual math? H-in-Q’s free Sample Size Calculator gives you the exact number in seconds, and our AI-powered research tools help you actually reach it. The next study you run should start with the right number, not a guess.