


Seventy percent of VC rejections cite “market size unclear” on the first pass, not because the market is actually too small, but because the founder threw out a single, unsupported billion-dollar number with no math behind it. TAM, SAM, and SOM are the three metrics that fix this: they turn a vague claim about market opportunity into a defensible, layered calculation an investor can actually verify. Get this framework wrong and you either scare off investors with an inflated, unbelievable TAM, or undersell your own opportunity by conflating a total market with what you can realistically capture. This guide breaks down exactly what TAM, SAM, and SOM mean, walks through one consistent worked example from top to bottom, and gives you a free calculator so you’re not building this in a spreadsheet from scratch. At H-in-Q, we built our free TAM SAM SOM Calculator because we kept seeing the same mistake in founder decks: a huge TAM, no SAM math, and a SOM that was really just a guess. In this guide, you’ll learn exactly how to size your market the way investors expect to see it.
🟡 DIRECT ANSWER: TAM SAM SOM is a market-sizing framework that breaks a business opportunity into three nested layers: Total Addressable Market (TAM), the maximum possible revenue if you captured 100% of the market; Serviceable Available Market (SAM), the portion of TAM your product can realistically serve given geography, pricing, and positioning; and Serviceable Obtainable Market (SOM), the slice of SAM you can realistically capture within 1-3 years given competition and resources. Each layer is calculated using either a top-down approach (starting from industry reports) or a bottom-up approach (starting from customer counts and pricing).
What Is TAM SAM SOM: The Definition That Actually Matters
TAM SAM SOM is a market-sizing framework that breaks your business opportunity into three nested layers, from broadest to most realistic. TAM (Total Addressable Market) is the maximum possible revenue for your product category if you captured 100% of the market with zero competition it’s a ceiling, not a target. SAM (Serviceable Available Market) narrows that down to the slice you can actually serve given your product’s geography, pricing, and positioning. SOM (Serviceable Obtainable Market) narrows further to what you can realistically capture within 1-3 years, accounting for competition, sales capacity, and brand awareness.
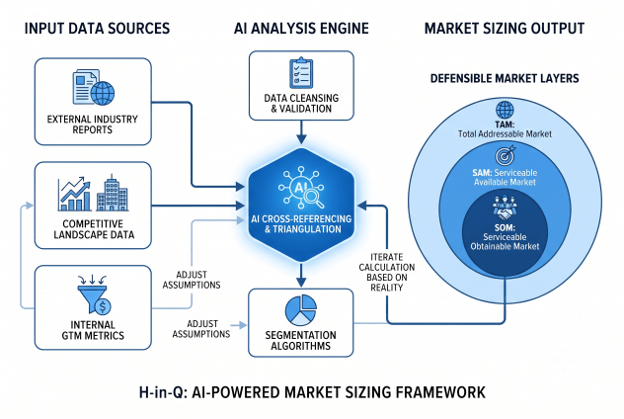
The relationship is simple to remember: TAM contains SAM, and SAM contains SOM. Each layer requires different data and a different level of confidence; TAM can come from broad industry reports, but SOM has to be grounded in your actual go-to-market capacity. This is also where AI-powered market research tools change the picture: instead of pulling one static analyst figure for TAM, AI-assisted secondary research can cross-reference multiple sources and surface the segment-specific data that makes SAM and SOM defensible rather than guessed.
Why Market Sizing Matters for Businesses in 2026
Investors don’t fund percentages of a market; they fund evidence that a specific number is achievable. According to a 2025 Carta benchmark, pitch decks with a credible, bottom-up SOM close Series A rounds roughly 40% faster than decks relying on top-down claims alone. That’s not a marginal difference; it’s the gap between a fundable deck and one that gets flagged for “market size unclear” before a partner meeting ever happens.
The real-world cost of skipping proper market sizing shows up in two directions. Founders who inflate TAM without a credible SAM and SOM path get challenged in diligence and lose momentum. Founders who never calculate TAM at all undersell a genuinely large opportunity because they only ever think in terms of their current customer list. A defensible TAM SAM SOM model does both jobs at once: it proves the ceiling is real, and it proves you know exactly how much of it you can actually win.
How to Calculate TAM SAM SOM: Step-by-Step
- Define your market scope precisely. Name the specific product category and problem you solve, not the broad industry. A budgeting app’s TAM is the personal finance tools market, not the entire fintech industry.
- Choose your calculation method: top-down or bottom-up. Top-down starts with an industry report (Gartner, IDC, IBISWorld) and applies percentage filters downward. Bottom-up starts with your actual customer count and pricing, then builds upward. Bottom-up produces a smaller, more defensible number, use both methods and let them cross-check each other.
- Calculate TAM using the bottom-up formula. TAM = total number of potential customers × average revenue per customer (ARPU). If there are 50,000 companies that fit your ideal customer profile globally and your ACV is $12,000, your TAM is $600 million.
- Apply your first SAM filter: geography and positioning. SAM = TAM × Serviceable %. If your product only serves companies in North America and Western Europe, and that’s 40% of your global TAM, your SAM is $240 million. Layer in additional filters; company size, industry vertical, language support, multiplying each percentage in sequence.
- Apply your second SAM filter: product fit. Not every company in your geography matches your feature set. If your product is built specifically for mid-market companies (100-1,000 employees) and that’s 25% of your geographic SAM, your refined SAM drops to $60 million.
- Calculate SOM using realistic capture assumptions. SOM = SAM × Obtainable %. For early-growth B2B companies, a realistic near-term SOM is typically 5-15% of SAM, factoring in your current sales capacity, competitive intensity, and brand awareness. At 8% of a $60 million SAM, your SOM is $4.8 million.
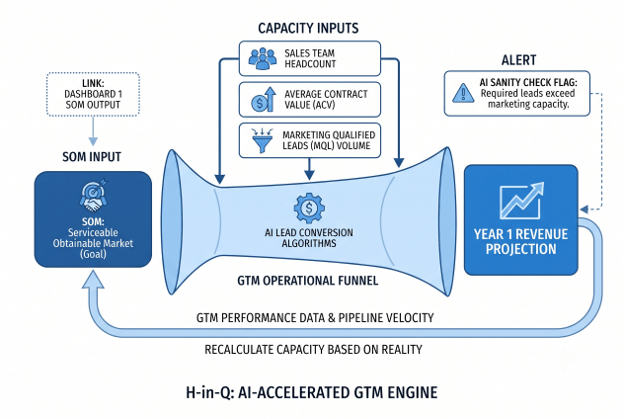
- Build your SOM from the bottom up, not as a round percentage. Rather than assuming “we’ll capture 1% of the market,” calculate how many customers your actual sales team, marketing budget, and current pipeline can realistically convert in year one, then verify that maps to a believable SAM percentage.
- Stress-test with the top-down number. Cross-check your bottom-up TAM against a top-down industry estimate for the same category. If the two numbers are wildly different, investigate which assumption is off before presenting either one.
TAM SAM SOM Best Practices: What Works, What Wastes Time
| Practice | Why It Matters |
|---|---|
| Build SOM from actual sales capacity, not a round percentage | “We just need 1% of a $100B market” is a red flag investors have seen thousands of times |
| Use bottom-up as your primary method | Produces a smaller but far more defensible number than pure top-down estimates |
| Keep geography consistent across all three layers | A global TAM with a single-country SAM creates a misleading, inconsistent picture |
| Cite specific data sources for each layer | “$50B market” with no citation reads as unresearched; a named source reads as diligence |
| Recalculate SOM as competitive data changes | Win rates aren’t uniform; concentrated competition in one segment lowers realistic SOM there |
| Treat TAM as context, not the headline metric | SOM is the number that should actually drive your revenue plan and quota setting |
The most common and costly mistake: claiming a large TAM with no visible math connecting it to SAM and SOM. Investors don’t reject big markets; they reject markets with no credible path from “total opportunity” to “what you’ll actually capture.”
How AI Is Transforming Market Sizing in 2026
Traditional market sizing relied on a single analyst report and a spreadsheet of assumed percentages. AI-powered research tools now let founders cross-reference dozens of sources simultaneously; industry reports, competitor funding data, hiring trends, technology adoption signals; to build a TAM that’s triangulated rather than borrowed wholesale from one source.
This matters most at the SAM and SOM layers, where generic industry reports are least useful. AI research assistants can synthesize competitor deployment patterns and market concentration data that used to require an expensive analyst subscription, helping founders identify exactly which segment of their SAM has the weakest incumbent competition; the segment where SOM is most achievable. At H-in-Q, our approach pairs this AI-assisted secondary research with our free TAM SAM SOM Calculator, so founders get both the triangulated data and a clean, presentable calculation in one workflow instead of stitching together five different tools.
Tools & Resources for Market Sizing
- H-in-Q TAM SAM SOM Calculator: free, guided top-down and bottom-up calculation.
- H-in-Q Sample Size Calculator: for validating SAM/SOM assumptions with real customer survey data.
- Industry reports (Gartner, IDC, IBISWorld): top-down starting points, best used to cross-check bottom-up figures.
- Government and trade association data: free, credible sources for geographic and demographic filters.
- H-in-Q Competitive Analysis Template: structures the competitive data that shapes a realistic SOM.
FAQ
What is TAM SAM SOM in simple terms?
TAM is the total market if you captured 100% of it with no competition. SAM is the slice you can realistically serve given your product and geography. SOM is what you can actually win in the near term given competitors and resources.
How do you calculate SAM from TAM?
Multiply TAM by the percentage of the market matching your specific geography, pricing, and target segment. Most SAM figures fall between 1% and 10% of TAM, though this varies significantly by how niche the product is.
What is a good SOM percentage for a startup?
Investors generally expect SOM between 5% and 15% of SAM for early-growth B2B companies within the first one to three years. Anything above 20% needs strong evidence of weak competition to be believable.
What's the difference between top-down and bottom-up market sizing?
Top-down starts with a broad industry report and narrows it with percentage assumptions, fast but often overestimates. Bottom-up starts with your actual customer count and pricing and builds upward, slower but far more defensible to investors.
How big should my TAM be for investors?
Venture-scale investors typically look for a TAM over $1 billion, a SAM over $100 million, and a SOM over $10 million to support a venture-scale outcome, though thresholds vary by fund size and stage.
Can TAM SAM SOM be calculated without market research reports?
Yes, a bottom-up approach uses your own customer count and pricing data instead of industry reports, which is often more accurate for new or niche markets where analyst coverage is thin or nonexistent.
Conclusion
TAM, SAM, and SOM aren’t three separate numbers to impress investors with, they’re one connected calculation that proves you understand both the size of the opportunity and exactly how much of it you can win. Start with a precise market definition, calculate TAM bottom-up wherever possible, filter down to SAM using real geographic and product-fit percentages, and build SOM from your actual sales capacity rather than a round guess. A credible, bottom-up SOM closes funding rounds roughly 40% faster than a top-down claim with no math behind it, that gap alone justifies doing this calculation properly. Ready to build yours? H-in-Q’s free TAM SAM SOM Calculator walks you through both methods in minutes, so your next pitch deck shows the math instead of just the headline number.