


Table of Contents
- What Are Legacy Access Panels
- Why Legacy Access Panels Are Failing Enterprises in 2026
- How to Detect and Eliminate Survey Fraud: A Systematic Approach
- Seven Behavioral Metrics That Instantly Expose Fraudulent Respondents
- Alternative Methodologies: Moving Beyond Compromised Panels
- How AI Is Transforming Survey Fraud Detection in 2026
- Essential Tools and Resources for Survey Data Integrity
- Protecting Enterprise Research Investments From Fraud
- Frequently Asked Questions
Between 15% and 40% of responses in legacy access panels now come from fraudulent sources bots, click farms, and professional survey takers gaming incentive systems. For enterprises investing six and seven figures in market research annually, this contamination transforms strategic insights into expensive fiction. A pricing study corrupted by 30% fraudulent respondents doesn’t just waste research budget; it poisons revenue models, product roadmaps, and market entry decisions for years.
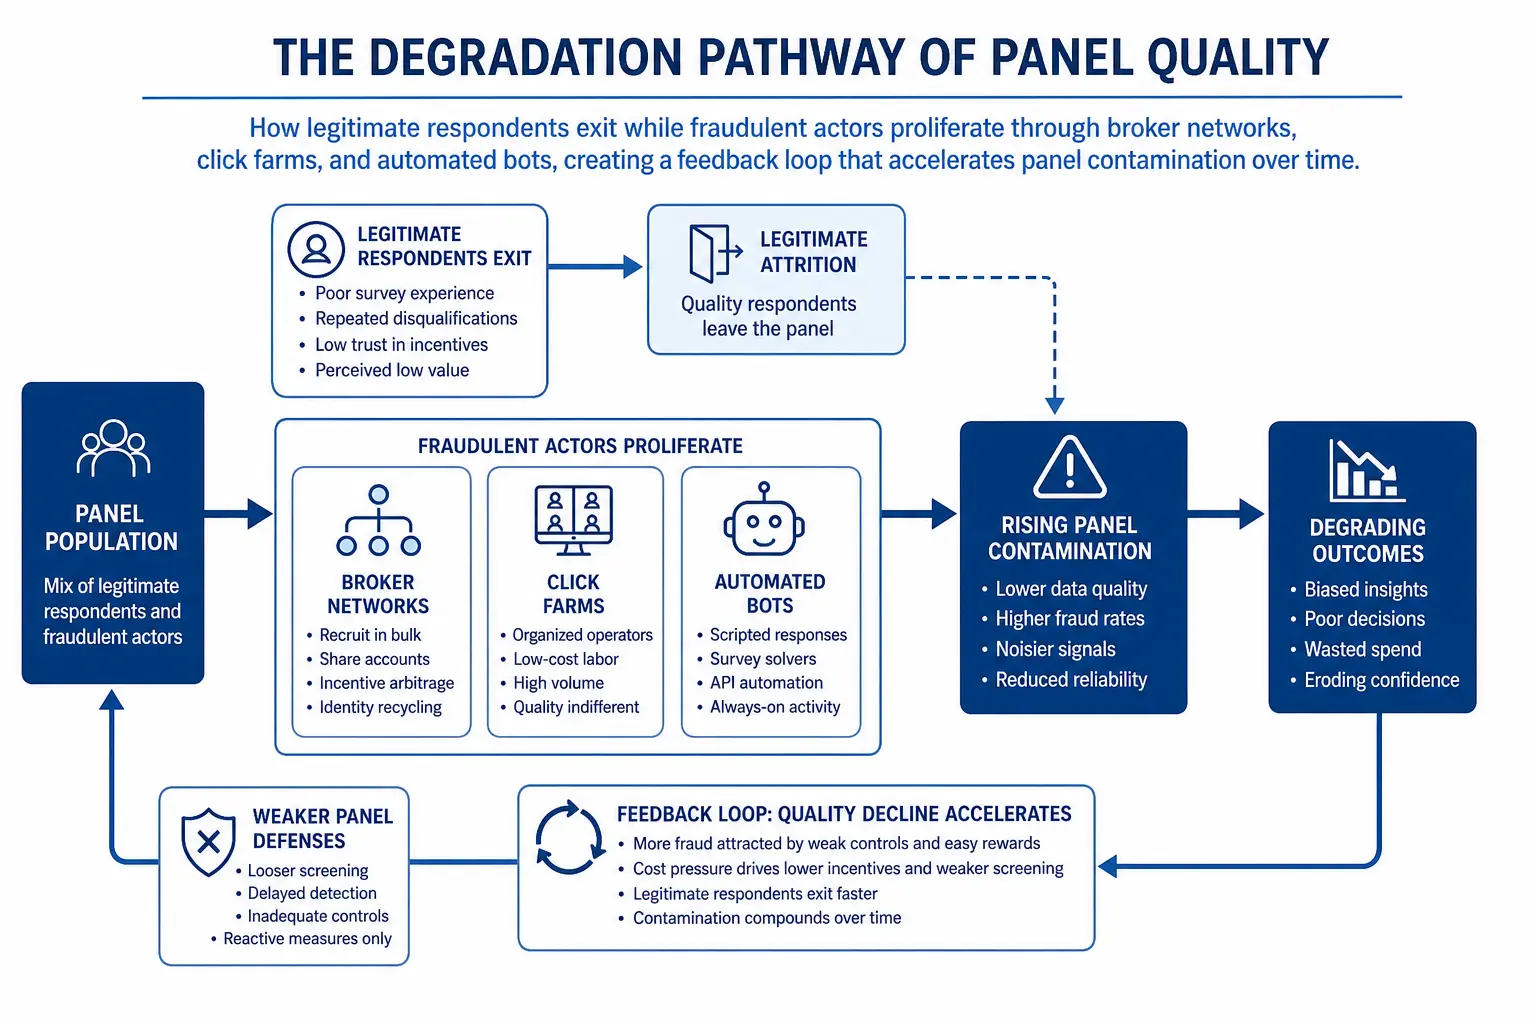
The infrastructure that powered market research for two decades is collapsing. Legacy access panels pre-recruited databases of survey respondents face an existential crisis as quality degrades faster than vendors can rebuild trust. Legitimate respondents abandon over-surveyed panels while fraudulent actors multiply through broker networks that prioritize volume over verification. Insight teams have worked across healthcare, technology, and financial services to identify and eliminate fraudulent survey data that had already influenced multi-million dollar decisions.
The threat extends beyond simple bots. Large language models now generate contextually appropriate open-ended responses. Click farms employ humans to bypass traditional fraud detection. Panel brokers sell the same respondents to dozens of competing vendors, creating professional survey takers who learn to game qualification screeners and attention checks.
In this guide, you’ll discover why legacy access panels are failing, how to detect and eliminate fraudulent survey respondents, what behavioral metrics expose sophisticated fraud, and which alternative methodologies protect enterprise research integrity in 2026.
What Are Legacy Access Panels
Legacy access panels are pre-recruited databases of survey respondents who have registered to participate in market research studies in exchange for incentives, typically managed by third-party vendors who sell access to researchers targeting specific demographic or professional segments. These panels emerged in the late 1990s as online research replaced telephone and mail surveys, offering researchers rapid access to targeted audiences without the cost and time requirements of recruiting fresh samples for each study.
The traditional panel model works through recruitment advertising that drives registrants to complete detailed profile surveys covering demographics, purchase behaviors, professional qualifications, and category interests. Vendors maintain these profiles in proprietary databases, then match incoming research projects to qualified panelists based on targeting criteria. Panelists receive email invitations to surveys matching their profiles, earning points, cash, or gift cards for completed responses.
For fifteen years, this model dominated online market research. Panels provided cost-effective access to hard-to-reach audiences healthcare professionals, C-suite executives, rare disease patients that would be prohibitively expensive to recruit through other channels. Major research buyers built entire methodologies around panel capabilities, from tracking studies fielded quarterly to the same respondents to complex conjoint analyses requiring hundreds of qualified participants.
The economics that made panels attractive also created the conditions for their collapse. As panel usage grew, legitimate respondents faced survey fatigue from excessive invitation volume. Simultaneously, the incentive structure attracted fraudulent actors who recognized that completing surveys generated reliable income with minimal oversight. Panel brokers emerged to arbitrage supply and demand, recruiting panelists once then selling access to dozens of competing vendors a practice that inflated apparent panel sizes while degrading quality through duplication and over-surveying.
Why Legacy Access Panels Are Failing Enterprises in 2026
The panel quality crisis reached critical mass in 2024-2026 as multiple degradation vectors converged. A 2024 industry analysis documented fraud rates between 25-45% in major B2B panels, with some healthcare professional panels showing contamination exceeding 60%. These numbers represent an inflection point where panel data quality falls below the threshold required for confident business decisions.
Professional survey takers now constitute the majority of active respondents in many panels. These individuals participate in dozens of surveys weekly, learning to recognize and bypass quality checks, memorizing consistent answers to profile questions across multiple panel memberships, and optimizing completion speed to maximize hourly earnings. Their responses reflect survey-taking expertise rather than genuine category knowledge or authentic attitudes.
Bot sophistication has escalated beyond simple automated form completion. Modern survey bots employ computer vision to solve CAPTCHAs, randomize response timing to mimic human behavioral variance, and increasingly leverage large language models to generate contextually appropriate open-ended responses that pass basic coherence checks. A bot network can complete thousands of surveys daily, splitting incentives with the panel accounts they compromise or the brokers who provide access.
Click farms add a human layer to fraud that defeats many automated detection systems. Operating primarily from regions with low labor costs, click farm workers complete surveys manually using VPNs and device spoofing to appear as legitimate respondents from target geographies. They follow scripts to maintain response consistency and employ shared knowledge bases documenting how to qualify for high-value studies. Because actual humans complete the surveys, they bypass behavioral detection systems designed to catch bots.
Panel broker networks amplify these problems by obscuring respondent identity across vendors. A single individual might hold accounts with six different brokers, each selling access to that person to multiple panel vendors, creating the illusion of unique respondents when researchers buy from different sources. This duplication means enterprises pay for sample diversity they never receive, and the same fraudulent or professional respondents contaminate studies across supposedly independent vendors.
The economic incentives driving panel degradation show no signs of reversing. As quality-conscious respondents exit over-surveyed panels, vendors face pressure to maintain claimed panel sizes and fulfillment speed. This pressure incentivizes looser verification standards, acceptance of broker-sourced respondents, and tolerance for quality issues that would have triggered account termination in earlier panel eras. The result is a death spiral where declining quality accelerates legitimate respondent attrition, further increasing reliance on fraudulent sources.
How to Detect and Eliminate Survey Fraud: A Systematic Approach
Protecting research integrity requires layered fraud detection implemented at multiple stages from sample sourcing through data delivery. No single check catches all fraud types; sophisticated fraudsters specifically engineer their approaches to bypass common detection methods. The following systematic approach combines preventive sourcing, real-time monitoring, and post-collection forensic analysis.
Step 1: Implement Source-Level Verification Before Survey Launch. Audit panel vendor fraud detection capabilities through technical documentation requests, not marketing claims. Require vendors to document their bot detection systems, device fingerprinting methods, IP validation processes, and respondent deduplication across their broker networks. Vendors unable or unwilling to provide technical specifics likely lack robust fraud prevention. Request fraud rate disclosures for similar studies they’ve fielded in the past six months, and establish contractual penalties for fraud rates exceeding agreed thresholds.
Step 2: Deploy Multi-Layer Real-Time Behavioral Monitoring. Instrument surveys with behavioral tracking that captures response timing at the question level, mouse movement patterns, device sensor data, and interaction sequences. Flag respondents completing complex grid questions in statistically improbable timeframes humans cannot read and thoughtfully answer a 10-item grid in eight seconds, but bots routinely do. Monitor for unnatural uniformity in timing patterns; humans show natural variance in reading and response speed, while bots and click farm workers following scripts show suspiciously consistent pacing.
Step 3: Embed Sophisticated Attention and Logic Checks. Move beyond simple “select option C” attention checks that fraudsters easily recognize and pass. Implement logic traps that require contextual understanding across multiple questions for example, asking about satisfaction with a product feature, then later asking frequency of using that same feature, flagging respondents who claim high satisfaction but never use it. Include open-ended questions requiring category-specific knowledge that LLMs struggle to fake convincingly, such as detailed process descriptions or technical terminology usage.
Step 4: Cross-Reference Digital Fingerprints and Geolocation Data. Collect device fingerprints combining browser configuration, screen resolution, installed fonts, and hardware identifiers to detect respondents using device spoofing or completing surveys from data centers rather than residential connections. Validate IP geolocation against claimed demographics a respondent claiming to live in Chicago but connecting from a Vietnamese IP address warrants investigation. Flag respondents using VPNs or proxy services, which legitimate consumer respondents rarely employ but fraudsters use routinely.
Step 5: Analyze Response Patterns for Statistical Anomalies. Apply statistical process control to identify respondents whose answer patterns deviate from expected distributions. Straight-lining (selecting the same response option repeatedly), diagonal patterns in grid questions, and excessive use of neutral midpoints all indicate low-engagement or fraudulent completion. Compare individual response distributions against the aggregate; fraudulent respondents often show answer patterns that are statistically improbable when examined against the broader sample.
Step 6: Conduct Cross-Survey Participation Analysis. For panel samples, request respondent participation history across all surveys fielded through that vendor in the past 90 days. Flag individuals completing more than 15-20 surveys monthly this volume indicates professional survey-taking rather than casual participation. Cross-reference respondent IDs against known fraud databases maintained by industry consortiums; sophisticated fraudsters reuse compromised credentials across multiple platforms.
Step 7: Perform Post-Collection Forensic Data Auditing. After data collection, conduct systematic quality audits examining multiple fraud indicators simultaneously. Calculate quality scores combining response timing, attention check performance, open-ended response quality, and behavioral consistency. Establish removal thresholds based on cumulative quality scores rather than single-metric failures this approach catches sophisticated fraudsters who pass individual checks but show suspicious patterns across multiple dimensions. Document all removals with specific justifications to support data integrity claims.
Step 8: Validate Findings Against External Benchmarks. Compare key findings against syndicated tracking data, government statistics, or other independent sources to identify results that deviate suspiciously from established benchmarks. Fraudulent data often shows compressed variance fewer extreme responses because fraudsters avoid answers that might trigger attention or seem “wrong.” If your survey shows implausibly high product awareness or category engagement compared to validated benchmarks, fraud contamination likely explains the discrepancy.
Seven Behavioral Metrics That Instantly Expose Fraudulent Respondents
1. Response Time Coefficient of Variation. Calculate the coefficient of variation (standard deviation divided by mean) for response times across all questions. Legitimate respondents show CVs between 0.4-0.8 as they speed through easy questions and slow for complex ones. Fraudulent respondents, especially bots and click farm workers following scripts, show CVs below 0.3 their timing is unnaturally consistent because they’re not actually reading and thinking.
2. Device Fingerprint Entropy Score. Device fingerprints with low entropy common browser configurations, default fonts, generic screen resolutions indicate virtual machines or device spoofing tools that fraudsters use to generate fake devices. Legitimate consumer devices show high entropy with personalized configurations, installed applications, and unique hardware combinations that are nearly impossible to replicate artificially.
3. Open-Ended Response Linguistic Complexity. Analyze open-ended responses for lexical diversity, sentence structure variation, and domain-specific terminology usage. LLM-generated responses often show unnaturally high grammatical perfection combined with generic phrasing that lacks the authentic voice and occasional errors characteristic of human writing. Responses that sound like marketing copy rather than conversational explanation warrant scrutiny.
4. Grid Question Diagonal Pattern Detection. In matrix or grid questions, calculate the correlation between response position and option selection. Fraudulent respondents frequently select answers in diagonal or geometric patterns (selecting option 1 for row 1, option 2 for row 2, etc.) because this approach minimizes cognitive load. Legitimate respondents show no correlation between row position and answer selection.
5. IP Address Reputation and Hosting Provider Analysis. Cross-reference respondent IP addresses against databases of known data centers, VPN exit nodes, and proxy services. Legitimate consumer respondents connect from residential ISPs; fraudulent respondents disproportionately connect from hosting providers, cloud services, and commercial VPNs. An IP address previously associated with spam, fraud, or bot activity across other platforms predicts survey fraud with high reliability.
6. Cross-Survey Participation Velocity. For panel respondents, calculate surveys completed per day over the past 30 days. Legitimate casual panelists average 2-4 surveys monthly. Professional survey takers complete 3-5 surveys daily, generating participation velocities 10-20× higher than authentic respondents. Anyone completing more than two surveys in a single day should trigger additional validation.
7. Response Entropy Within Scaled Questions. Calculate Shannon entropy for responses within scaled batteries the degree of variation in answer selections. Fraudulent respondents show lower entropy because they use satisficing strategies like always selecting the midpoint or alternating between two adjacent options. Legitimate engaged respondents show higher entropy as they discriminate between items based on genuine attitudes.
Alternative Methodologies: Moving Beyond Compromised Panels
As legacy access panel quality deteriorates beyond repair for many use cases, enterprises are adopting alternative sampling methodologies that reduce fraud exposure and access higher-quality respondents.
River sampling intercepts respondents from live web traffic through publisher partnerships and programmatic advertising networks. Rather than recruiting panelists who join a database and receive survey invitations, river sampling captures users during natural browsing sessions on content sites, social platforms, and mobile applications. This approach eliminates professional survey-taker contamination because respondents never join a panel or develop survey-taking expertise. River samples provide access to harder-to-reach audiences who would never register for a panel but will complete a single survey when encountered in context.
Social media recruitment through platform advertising APIs enables precise targeting while maintaining respondent authenticity. Researchers can target ads to specific demographic, behavioral, and interest segments, driving qualified respondents to surveys without panel intermediaries. This method works particularly well for consumer categories where social platform data provides rich targeting signals. The challenge lies in managing cost per complete, which typically exceeds panel pricing but delivers substantially higher data quality.
Customer database sampling leverages first-party data that enterprises already own. For customer satisfaction, product feedback, and loyalty research, sampling from CRM databases eliminates fraud risk entirely you’re surveying verified customers with transaction histories. This approach requires careful sampling design to avoid over-surveying valuable customers, but it provides the highest confidence in respondent authenticity and relevance.
Hybrid methodologies combine multiple sources to balance cost, speed, and quality. A typical hybrid approach might use customer database sampling for current customers, river sampling for competitive brand users, and carefully vetted panel sources for low-incidence audiences that are prohibitively expensive to reach through other channels. The key is recognizing that no single source optimizes all dimensions simultaneously; strategic source mixing based on research objectives produces better outcomes than defaulting to panels for every study.
How AI Is Transforming Survey Fraud Detection in 2026
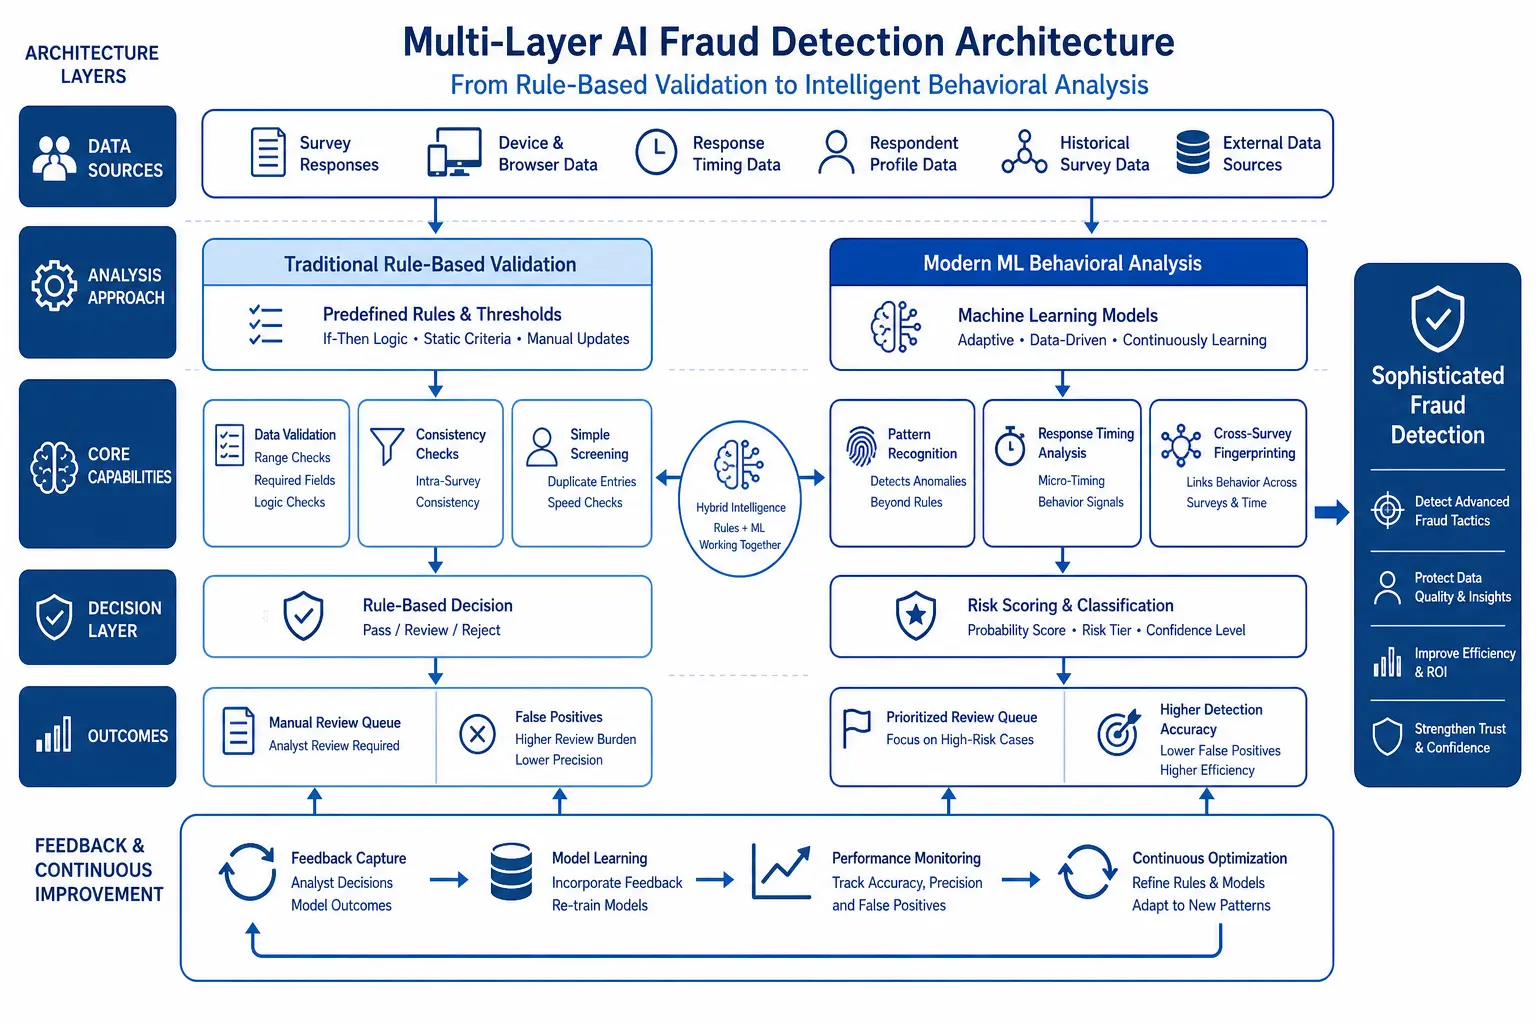
Artificial intelligence has become the primary weapon in the fraud detection arms race, enabling pattern recognition at scales and speeds impossible for human analysts. Machine learning models trained on millions of survey responses can identify subtle behavioral signatures that distinguish authentic engagement from fraudulent completion.
Behavioral biometric analysis applies computer vision and sensor fusion to detect non-human survey completion. These systems analyze mouse movement trajectories, click pressure patterns, scroll behavior, and device orientation changes to build behavioral profiles. Humans show natural micro-corrections, curved mouse paths, and variable interaction speeds; bots show perfectly straight lines, instantaneous direction changes, and mechanical consistency. Advanced systems can identify click farm workers by detecting multiple respondents sharing identical behavioral patterns a signature of script-following that human analysts would miss.
Natural language processing models evaluate open-ended responses for authenticity markers that separate human writing from LLM generation. While early LLM-generated responses were easy to spot due to overly formal language and generic phrasing, 2026-era language models produce more convincing text. Detection systems now analyze semantic coherence across multiple open-ended questions, looking for inconsistencies that reveal copy-paste or template usage, and examining linguistic fingerprints like vocabulary diversity and syntactic complexity that differ between human and AI writing.
Cross-platform identity resolution links respondent behavior across surveys, panels, and digital properties to build comprehensive fraud profiles. These systems use probabilistic matching combining device fingerprints, behavioral patterns, and demographic consistency to identify when the same individual or bot operates multiple accounts. This capability is particularly valuable for detecting panel broker fraud, where the same respondent appears as supposedly unique individuals across different vendor sources.
Predictive fraud scoring assigns real-time quality probabilities to each respondent as they progress through a survey, enabling dynamic intervention. Rather than waiting for post-collection analysis, these systems flag suspicious respondents during completion, either terminating them immediately or routing them to additional validation questions. This approach reduces fraud data collection and allows researchers to replace flagged respondents in real-time, maintaining target sample sizes without compromising quality.
A good approach to survey fraud detection should integrate multiple AI systems into a unified quality assurance framework that adapts to evolving fraud tactics. By combining behavioral biometrics, NLP analysis, cross-platform identity resolution, and predictive scoring, this methodology should aim to achieve fraud detection rates exceeding 95% while maintaining false positive rates below 2% the threshold where quality enforcement doesn’t inadvertently remove legitimate respondents.
Essential Tools and Resources for Survey Data Integrity
Relevant ID provides device fingerprinting and digital identity verification specifically designed for market research applications. Their platform analyzes over 50 device and behavioral signals to detect duplicate respondents, bot traffic, and VPN usage, integrating directly with major survey platforms to flag suspicious respondents in real-time.
Imperium offers a comprehensive fraud detection suite combining behavioral analytics, IP reputation scoring, and cross-survey participation tracking. Their RelevantID solution has become an industry standard for panel quality verification, providing fraud scores that researchers can use to filter samples before analysis. The platform maintains a global fraud database enabling cross-client pattern detection.
Qualtrics Fraud Detection embeds quality controls directly into the survey platform, including bot detection, attention checks, and response pattern analysis. Their machine learning models automatically flag suspicious respondents based on timing, consistency, and behavioral anomalies, with configurable thresholds that researchers can adjust based on study requirements and risk tolerance.
Lucid Quality Assurance provides multi-layer fraud prevention for marketplace-sourced samples, including pre-survey digital fingerprinting, real-time behavioral monitoring, and post-collection forensic analysis. Their Quality Score metric combines multiple fraud indicators into a single respondent-level quality assessment that researchers can use for data cleaning decisions.
FraudScore specializes in IP reputation analysis and geolocation verification, cross-referencing respondent connection data against databases of known data centers, VPN services, and proxy networks. This tool is particularly valuable for international research where geographic verification is critical for sample validity.
OpenText Magellan applies advanced text analytics and NLP to evaluate open-ended response quality, detecting copy-paste behavior, template usage, and LLM-generated content. The platform can process thousands of responses in seconds, flagging suspicious text patterns that would take human analysts hours to identify.
Protecting Enterprise Research Investments From Fraud
The collapse of legacy access panels represents both a crisis and an opportunity for enterprise market research. Organizations that continue defaulting to compromised panel sources will make increasingly expensive decisions based on fraudulent data. Those that adapt their methodologies, implement rigorous fraud detection, and diversify sample sources will gain competitive advantage through higher-quality insights.
The path forward requires acknowledging that the panel model that served research well for fifteen years has fundamentally broken. Fraud rates in many legacy panels now exceed levels where data remains usable for strategic decision-making. Survey fraud is not a quality control problem that better attention checks will solve; it is a structural problem requiring methodological transformation. Enterprises must rebuild research programs around fraud-resistant sampling approaches, from river sampling and social recruitment to customer database sampling and hybrid methodologies.
Technology provides powerful tools for detecting and eliminating fraudulent responses, but technology alone cannot compensate for fundamentally compromised sample sources. AI-powered fraud detection, behavioral biometrics, and cross-platform identity resolution dramatically improve data quality when applied to samples with manageable fraud rates. These same tools cannot rescue data from panels where fraud exceeds 40-50% of responses at that contamination level, the underlying sample is unsalvageable regardless of post-collection cleaning.
The financial stakes demand action. Survey fraud costs enterprises billions annually in direct research spending and opportunity costs from flawed strategic decisions. A single contaminated pricing study can poison revenue models for years. A fraudulent market sizing analysis can justify market entry investments that were never viable. The cost of implementing rigorous fraud detection and diversifying sample sources is negligible compared to the cost of decisions based on fraudulent data.
Explore how H-in-Q.com can help your organization implement AI-powered fraud detection systems and transition to fraud-resistant research methodologies that protect your strategic insights from contamination. The enterprises that act now to address the panel quality crisis will gain years of competitive advantage through better data while competitors continue making decisions based on fiction.
Frequently Asked Questions
What percentage of survey responses from legacy access panels are fraudulent?
Industry estimates place fraudulent responses in legacy access panels between 15-40% depending on panel source and screening rigor. High-value surveys (B2B, healthcare professionals) face fraud rates exceeding 50% as incentive amounts attract more sophisticated fraudsters and bot networks targeting premium panels.
How do survey bots bypass traditional attention checks?
Modern survey bots use computer vision to solve CAPTCHAs, randomize response timing to mimic human behavior, and employ large language models to generate contextually appropriate open-ended responses. They analyze question logic to provide consistent answers across validation traps that would catch simple bots.
What is river sampling and how does it differ from panel sampling?
River sampling intercepts respondents from live web traffic through ad networks and publisher partnerships, capturing users in natural browsing contexts rather than recruiting pre-registered panelists. This method reduces professional survey-taker contamination and provides access to harder-to-reach audiences who never join traditional panels.
Can AI synthetic respondents replace human survey participants?
AI synthetic respondents can simulate demographic segments and answer patterns based on training data, but they cannot capture genuine human experience, emotional nuance, or emerging attitudes not present in historical datasets. They serve best as data augmentation for scenario testing, not replacement for primary human research.
What behavioral metrics most reliably detect fraudulent survey respondents?
Response time variance, device fingerprint consistency, IP geolocation alignment with claimed demographics, mouse movement naturalness, and cross-survey participation patterns are the most reliable fraud indicators. Fraudulent respondents show statistically improbable speed consistency and participate in unusually high survey volumes across multiple platforms.
How much does survey fraud cost enterprises annually?
Survey fraud costs enterprises an estimated $4.8 billion annually in wasted research spending and flawed strategic decisions based on contaminated data. This figure includes direct research costs, opportunity costs from incorrect market entry decisions, and product failures resulting from fraudulent preference data.