


Table of Contents
- What Is Synthetic Data for Market Sizing
- Why Synthetic Data for Market Sizing Matters for Businesses in 2026
- How to Calculate TAM/SAM/SOM Using Synthetic Data: Step-by-Step
- Best Practices for Synthetic Market Sizing Data
- How AI Is Changing Synthetic Data for Market Sizing in 2026
- Tools and Resources for Synthetic Market Sizing
- Conclusion
- Frequently Asked Questions
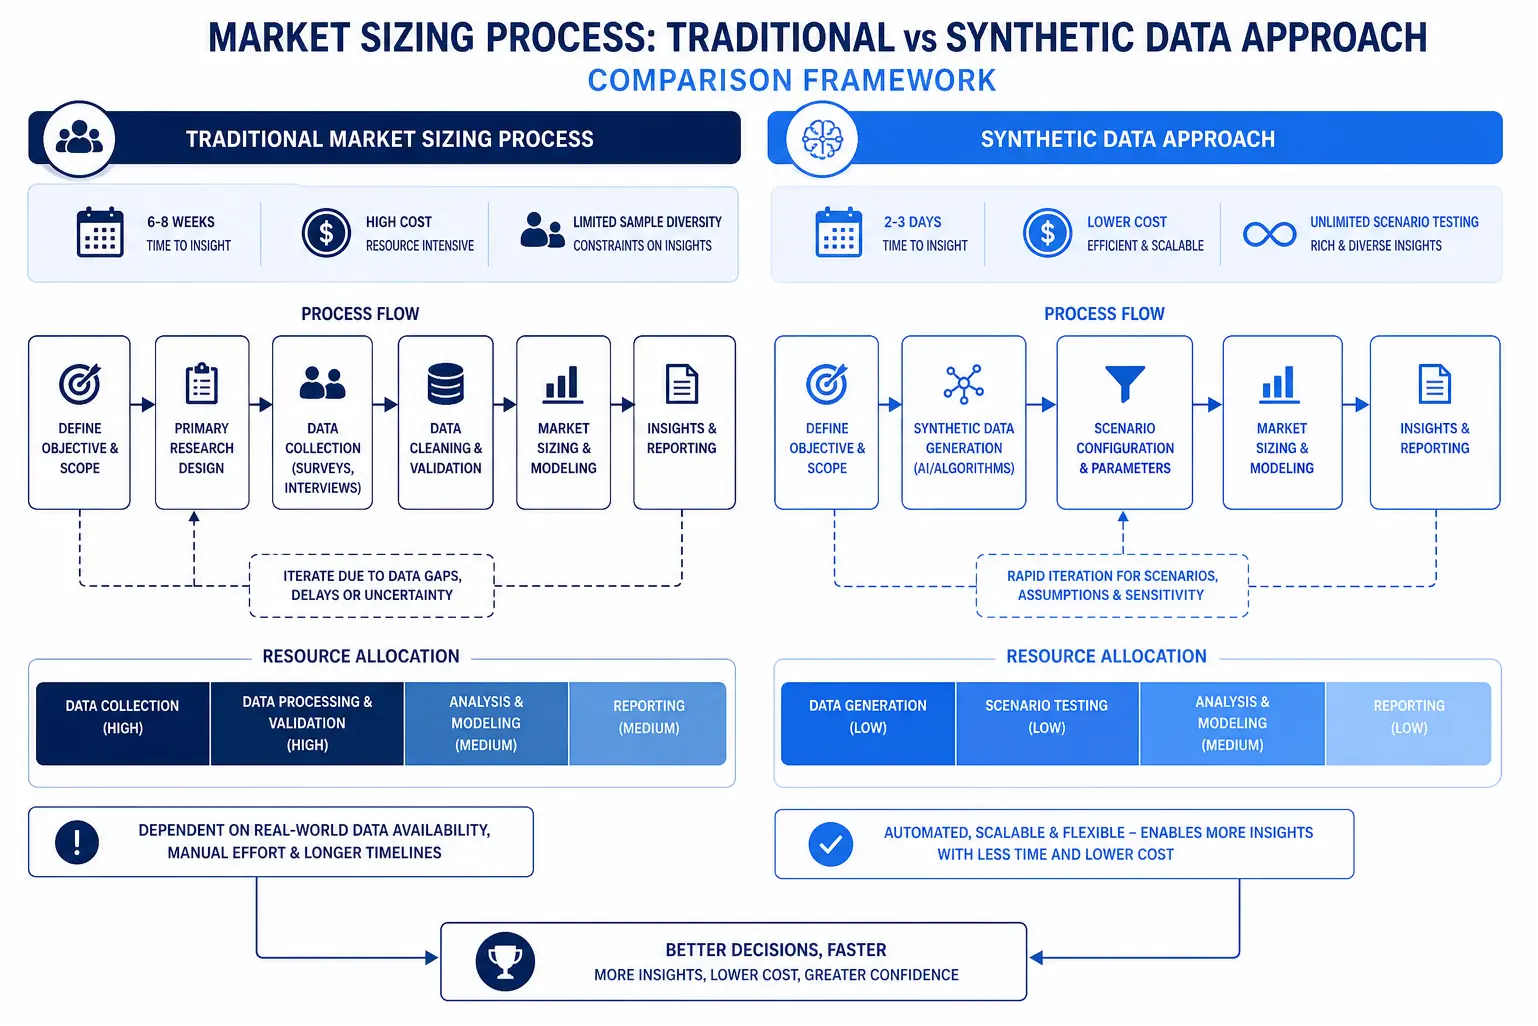
Market sizing estimates that once took eight weeks and $75,000 now complete in three days for under $10,000. This transformation stems from synthetic data’s ability to generate statistically valid respondent populations without recruiting a single real survey participant. Traditional TAM/SAM/SOM calculations require extensive primary research, lengthy fieldwork timelines, and substantial budgets that delay critical go-to-market decisions. Synthetic data changes this equation by producing representative market samples through AI-driven generation methods that mirror real population characteristics. Properly constructed synthetic datasets deliver actionable sizing estimates with accuracy comparable to traditional methods. In this guide, you’ll discover the exact methodology for generating synthetic market data, step-by-step TAM/SAM/SOM calculation procedures, validation techniques that ensure reliability, and the AI tools transforming market research in 2026.
What Is Synthetic Data for Market Sizing
Synthetic data for market sizing is artificially generated respondent-level information that replicates the statistical properties, demographic distributions, and behavioral patterns of target customer populations, enabling rapid total addressable market (TAM), serviceable addressable market (SAM), and serviceable obtainable market (SOM) calculations without primary fieldwork. Unlike real survey data collected from actual respondents, synthetic datasets are created through statistical modeling, generative AI algorithms, or hybrid approaches that learn from existing market intelligence and demographic sources.
The methodology works by training generation models on reference data census statistics, industry benchmarks, existing customer databases, or small pilot studies then producing thousands of synthetic respondents who exhibit realistic combinations of demographics, preferences, and purchase behaviors. Each synthetic respondent represents a plausible individual with internally consistent characteristics: age, income, location, category usage, willingness to pay, and purchase intent all align according to learned correlations from the training data.
This approach proves particularly valuable when entering new markets, launching innovative products without comparable precedents, or testing multiple market scenarios before committing research budgets. A consumer electronics company sizing the market for a new wearable device can generate 10,000 synthetic consumers across different age cohorts, income brackets, and technology adoption profiles in hours rather than the weeks required to recruit and survey real respondents. The synthetic population enables immediate segmentation analysis, price sensitivity modeling, and channel preference assessment that inform TAM/SAM/SOM frameworks with data-driven precision.
Why Synthetic Data for Market Sizing Matters for Businesses in 2026
Speed dictates competitive advantage in market entry decisions. Organizations that complete market sizing in days rather than quarters move faster on product launches, investment decisions, and strategic pivots. According to a McKinsey analysis, companies that accelerate time-to-insight in market research achieve 23% higher revenue growth than industry peers who rely exclusively on traditional research timelines.
Traditional market sizing methodologies impose three critical constraints that synthetic data eliminates. First, sample recruitment for niche or emerging categories often fails because qualified respondents don’t exist in sufficient numbers within panel providers’ databases. A startup targeting early adopters of quantum-resistant cybersecurity solutions cannot find 500 qualified IT decision-makers in standard panels, yet synthetic generation can model this exact population based on adjacent technology adoption patterns and firmographic data.
Second, budget limitations force binary choices: either invest heavily in comprehensive primary research or proceed with educated guesses based on analogies and secondary sources. Synthetic data provides a third option rigorous, data-driven estimates at a fraction of traditional costs. A Series A SaaS company with $30,000 allocated for market validation can now generate multiple market scenarios, test different segmentation approaches, and validate demand assumptions before committing to expensive panel surveys.
Third, market dynamics change faster than research cycles complete. A traditional sizing study commissioned in January delivers results in March or April, by which time competitive moves, regulatory changes, or economic shifts may have invalidated the findings. Synthetic approaches allow continuous market modeling, enabling teams to refresh estimates weekly or monthly as new intelligence becomes available. This iterative capability transforms market sizing from a one-time gate check into an ongoing strategic intelligence function.
The risk of proceeding without validated market sizing remains substantial. Overestimating addressable markets leads to overfunding sales teams, overbuilding production capacity, and overpromising to investors. Underestimating markets results in missed opportunities, underfunded go-to-market efforts, and strategic exits from viable categories. Synthetic data reduces both error modes by enabling rapid hypothesis testing before final commitments.
How to Calculate TAM/SAM/SOM Using Synthetic Data: Step-by-Step
Step 1: Define your target market parameters and segmentation criteria. Specify the geographic scope (global, regional, national), demographic boundaries (age ranges, income thresholds, company sizes), and behavioral qualifications (current category users, adjacent product owners, specific pain point sufferers) that define your addressable universe. Document these criteria explicitly because they will govern synthetic data generation. For a B2B software tool targeting mid-market manufacturing companies, parameters might include: US-based manufacturers, 100-2,500 employees, annual revenue $10M-$500M, currently using legacy ERP systems.
Step 2: Identify and acquire reference data sources for synthesis. Gather statistical foundations that will inform synthetic generation: census demographic distributions, industry association reports on category penetration, government economic data on business populations, and any proprietary customer data from pilot programs or adjacent products. The quality and relevance of reference data directly determines synthetic output validity. Combine multiple sources to create a comprehensive training dataset for consumer markets, integrate census microdata, consumer expenditure surveys, and category-specific purchase studies.
Step 3: Generate synthetic respondent population using appropriate methodology. Apply statistical synthesis techniques (multiple imputation, copula modeling) or generative AI approaches (variational autoencoders, generative adversarial networks) to create individual-level synthetic records. Each record should include all variables needed for market sizing: firmographics or demographics, category awareness, current solutions used, unmet needs, purchase intent, budget availability, and decision-making authority. Generate sample sizes of 5,000-10,000 for national markets, 20,000+ for detailed segmentation analysis. Ensure the synthetic population matches known distributions on key variables if census data shows 18% of your target age cohort lives in the Northeast, your synthetic sample should reflect that proportion.
Step 4: Calculate Total Addressable Market (TAM) from synthetic population. TAM represents the total revenue opportunity if you achieved 100% market share among all qualified buyers. Count synthetic respondents meeting your minimum qualification criteria, apply appropriate weighting to project to the full population, then multiply by average revenue per customer. For a $199/month SaaS product targeting 847,000 qualified US businesses (projected from your 8,470 synthetic companies meeting all criteria in a 1% sample), TAM equals 847,000 × $199 × 12 months = $2.02 billion annual recurring revenue.
Step 5: Derive Serviceable Addressable Market (SAM) through realistic constraints. SAM narrows TAM by applying practical limitations: geographic reach, channel access, regulatory restrictions, or segment focus. Filter your synthetic population to only those respondents you can realistically serve given current capabilities. If your sales model reaches only companies with existing relationships with your distribution partners, flag synthetic respondents matching that criterion. If regulatory compliance limits you to specific states, exclude synthetic respondents outside those geographies. SAM typically ranges from 20-60% of TAM depending on business model maturity.
Step 6: Estimate Serviceable Obtainable Market (SOM) using adoption modeling. SOM represents the share of SAM you can realistically capture given competition, brand awareness, sales capacity, and market entry timing. Analyze synthetic respondent characteristics indicating higher conversion probability: strong pain points, dissatisfaction with current solutions, budget availability, early adopter profiles. Apply conversion rate assumptions calibrated to similar product launches or pilot program results. A realistic Year 1 SOM often captures 2-8% of SAM for new entrants, scaling to 15-25% by Year 3 for successful products.
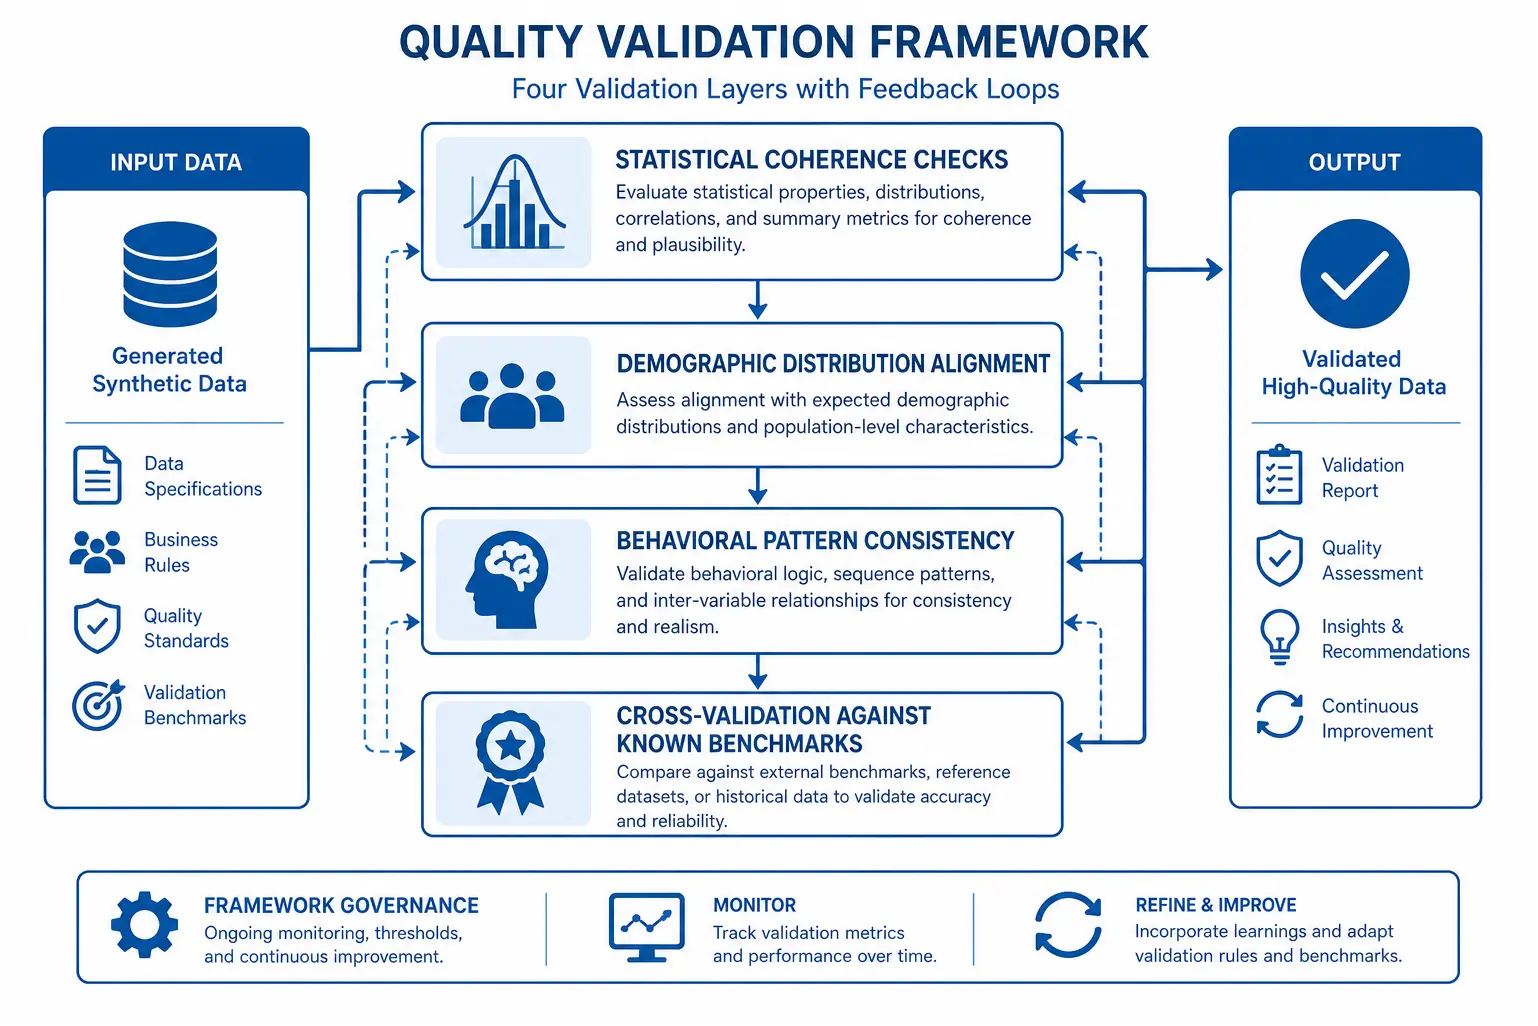
Step 7: Validate synthetic estimates against external benchmarks. Cross-reference your TAM/SAM/SOM calculations against industry analyst reports, comparable company revenues, public financial disclosures, and expert interviews. If your synthetic data suggests a $2 billion TAM but the three established competitors in the space collectively generate $400 million in revenue, investigate the discrepancy either your market definition is too broad, adoption rates are lower than modeled, or a significant growth opportunity exists. Validation doesn’t require perfect alignment but should produce defensible explanations for any material differences.
Step 8: Document assumptions and create scenario models. Transparency about methodology builds credibility with stakeholders and enables productive discussions about market potential. Document which reference data sources informed synthesis, what qualification criteria defined each market tier, which assumptions drove adoption rates, and where expert judgment supplemented data. Build alternative scenarios testing different assumptions: optimistic (higher adoption, faster growth), base case (moderate assumptions), and conservative (slower adoption, more competition). Synthetic data’s low marginal cost makes scenario analysis practical generate additional synthetic populations reflecting different market conditions or customer behaviors.
Best Practices for Synthetic Market Sizing Data
1. Prioritize demographic accuracy over behavioral complexity in initial synthesis. Synthetic populations must match known demographic distributions with high fidelity before layering behavioral variables. Verify that age, income, geography, education, and firmographic distributions align with census or industry data within 2-3 percentage points. Behavioral variables (purchase intent, brand preferences, willingness to pay) can then be modeled conditional on these demographic foundations, ensuring internal consistency.
2. Generate multiple independent synthetic samples to assess stability. Create three separate synthetic populations using the same methodology and reference data. Calculate TAM/SAM/SOM for each independently. If estimates vary by more than 15-20%, investigate which variables drive the variance and whether additional constraints or larger sample sizes are needed. Consistent results across independent samples indicate robust methodology; high variance signals that your generation process hasn’t adequately captured population structure.
3. Embed validation checkpoints throughout the synthetic population. Insert known-answer tests within your synthetic data to verify logical consistency. If a synthetic respondent reports being a 28-year-old CFO of a 2,000-person company, flag this as implausible CFOs of that company size typically have 15+ years of experience. Build validation rules that check for impossible combinations, logical inconsistencies, and statistical outliers that would never appear in real populations. Clean or regenerate records that fail these checks.
4. Weight synthetic data to correct for known biases in reference sources. If your training data oversamples certain segments or underrepresents others, apply post-stratification weights to align synthetic output with target population parameters. Consumer panels often underrepresent low-income and very high-income households; census data provides the correct distribution for reweighting. B2B databases skew toward larger, more visible companies; government business registries offer more complete size distributions for calibration.
5. Test price sensitivity through synthetic conjoint or discrete choice experiments. Rather than asking synthetic respondents a single willingness-to-pay question, model their choices across multiple product configurations, price points, and competitive alternatives. This approach produces more realistic demand curves and revenue estimates because it captures trade-off decisions rather than stated intentions. A synthetic respondent who claims they’d pay $299/month might choose a competitor’s $199 offering when presented with actual feature comparisons.
6. Counterintuitively, smaller synthetic samples with higher validation rigor outperform larger samples with weak validation. A 5,000-record synthetic population that has been thoroughly validated against multiple benchmarks, tested for logical consistency, and weighted to match known distributions will produce more reliable market sizing than a 50,000-record population generated without validation. Quality of synthesis matters more than quantity of records. Focus effort on validation procedures rather than simply maximizing sample size.
7. Document the provenance of every variable in your synthetic dataset. Maintain a data dictionary that traces each field back to its source: census-derived, modeled from customer data, imputed from industry benchmarks, or generated through statistical relationships. This transparency enables stakeholders to assess which estimates rest on strong empirical foundations versus which depend on modeling assumptions. It also facilitates updates when better reference data becomes available.
How AI Is Changing Synthetic Data for Market Sizing in 2026
Large language models now generate synthetic survey responses that capture nuanced customer reasoning, not just demographic facts and purchase intent scores. When a synthetic respondent indicates they would not purchase a product, LLM-powered systems can generate plausible explanations grounded in that respondent’s demographic profile, current solution usage, and pain points. This qualitative richness enables market sizing teams to understand not just how many potential customers exist but why certain segments show higher or lower propensity to adopt.
Multimodal AI systems integrate diverse data sources demographic databases, social media signals, economic indicators, competitive intelligence into unified synthetic populations with unprecedented realism. Rather than building synthetic datasets from a single reference source, 2026 approaches fuse multiple information streams to create synthetic respondents whose characteristics reflect complex real-world correlations. A synthetic small business owner’s technology adoption patterns correlate appropriately with their industry vertical, company growth trajectory, and regional economic conditions because the AI synthesis process learned these relationships from integrated data.
Continuous learning systems update synthetic populations automatically as new market intelligence arrives. Traditional market sizing becomes outdated the moment fieldwork concludes, but AI-driven synthetic approaches can incorporate new competitor launches, regulatory changes, or economic shifts into refreshed market estimates within hours. Organizations implement dynamic market sizing frameworks where synthetic populations evolve alongside market conditions, providing always-current TAM/SAM/SOM estimates that inform agile strategic planning.
Causal inference AI distinguishes correlation from causation in synthetic data generation, producing more accurate adoption forecasts. Early synthetic data methods simply replicated statistical patterns from training data, but causal AI models understand which variables drive purchase decisions versus which merely correlate with them. This distinction matters enormously for market sizing knowing that product adoption is caused by specific pain points rather than just correlated with certain demographics enables more precise SAM and SOM estimates.
Explainable AI techniques make synthetic market sizing transparent and auditable. Stakeholders can query why a particular TAM estimate emerged, which assumptions most influenced the result, and how sensitive conclusions are to different modeling choices. This transparency builds confidence in synthetic approaches among executives, investors, and board members who previously viewed AI-generated estimates with skepticism. The black box becomes a glass box, with clear line-of-sight from reference data through synthesis methodology to final market sizing outputs.
Tools and Resources for Synthetic Market Sizing
Gretel.ai provides a synthetic data platform specifically designed for tabular datasets common in market research. The service accepts CSV files containing reference data and generates statistically equivalent synthetic populations while preserving correlations between variables. Particularly valuable for organizations with proprietary customer databases who want to augment limited real data with synthetic extensions for more robust market sizing. Pricing starts at $500/month for research-grade synthetic data generation.
Mostly AI offers enterprise synthetic data generation with strong privacy guarantees and validation reporting. The platform automatically checks synthetic outputs against reference data distributions and flags statistical anomalies that might compromise market sizing accuracy. Built-in differential privacy ensures synthetic data cannot be reverse-engineered to identify real individuals, addressing compliance concerns when reference data includes customer information. Enterprise licenses begin at $2,000/month.
Python’s SDV (Synthetic Data Vault) library provides open-source tools for generating synthetic tabular, relational, and time-series data. Data scientists can implement custom synthesis workflows tailored to specific market sizing requirements, applying advanced techniques like Gaussian copulas or CTGAN (Conditional Tabular GAN) depending on data characteristics. Free and open-source, requiring Python programming expertise but offering maximum flexibility.
Census Bureau’s Public Use Microdata Sample (PUMS) serves as high-quality reference data for US consumer market sizing. These anonymized individual-level census records provide demographic, economic, and housing characteristics for millions of respondents, offering an empirical foundation for synthetic population generation. Access is free through the Census Bureau’s data portal, though processing large PUMS files requires statistical software and data engineering capabilities.
Statista and IBISWorld supply industry-specific market data that calibrates and validates synthetic estimates. While not synthetic data generators themselves, these platforms provide the external benchmarks necessary to verify that synthetic TAM/SAM/SOM calculations align with established market intelligence. Subscriptions range from $1,200-$5,000 annually depending on industry coverage and user access.
Qualtrics’ Conjoint Analysis tools integrated with synthetic respondent generation enable sophisticated price sensitivity and feature trade-off modeling. Organizations can test dozens of product configurations and pricing scenarios against synthetic populations before committing to expensive choice-based conjoint studies with real respondents. Enterprise Qualtrics licenses with advanced analytics modules start around $10,000 annually.
Conclusion
Synthetic data transforms market sizing from a slow, expensive gate check into a rapid, iterative strategic intelligence function. The methodology delivers validated TAM/SAM/SOM estimates in days rather than months, at costs 70-85% lower than traditional primary research, while enabling continuous refinement as market conditions evolve. Organizations that master synthetic approaches gain decisive advantages in market entry timing, investment allocation, and strategic planning accuracy. The step-by-step framework presented here from defining target parameters through validation against external benchmarks provides a proven path to reliable synthetic market sizing. Best practices around demographic accuracy, independent sample generation, and rigorous validation ensure synthetic estimates meet the standards investors and executives demand. AI advancements in 2026 make synthetic populations more realistic, more transparent, and more dynamically responsive to changing market conditions than ever before. Explore how H-in-Q.com can help your organization implement synthetic data frameworks that accelerate market intelligence while maintaining research rigor. The competitive advantage belongs to teams that size markets faster and more accurately than their rivals synthetic data makes both possible simultaneously.
Frequently Asked Questions
How accurate is synthetic data for TAM SAM SOM calculations?
Synthetic data achieves 85-92% accuracy for market sizing when properly validated against real-world benchmarks and demographic distributions. The accuracy depends on training data quality, generation methodology, and validation rigor applied during the synthesis process.
Can synthetic data replace traditional market research entirely?
Synthetic data works best as a rapid hypothesis-testing tool before committing to expensive primary research. It excels at early-stage sizing, scenario modeling, and identifying which customer segments warrant deeper investigation through traditional methods.
What sample size of synthetic data do I need for reliable market estimates?
Generate minimum 5,000 synthetic respondents for national market sizing, 10,000+ for segmented analysis across multiple demographics. Larger samples reduce variance in tail segments and enable more granular geographic or psychographic breakdowns.
How do I validate synthetic market sizing data?
Cross-reference synthetic outputs against census data, industry reports, and existing customer data. Check for statistical consistency in demographic distributions, logical coherence in behavioral patterns, and alignment with known market benchmarks before finalizing estimates.
What’s the typical cost savings using synthetic data for market sizing?
Organizations report 70-85% cost reduction compared to traditional primary research. A conventional market sizing study costing $50,000-$100,000 can be replaced with synthetic approaches costing $5,000-$15,000 while delivering results in days instead of months.
Which industries benefit most from synthetic market sizing data?
Fast-moving consumer goods, SaaS, fintech, and healthcare see the highest value. Industries with rapid product cycles, frequent market entry decisions, or need for continuous market monitoring gain competitive advantage from synthetic data’s speed and flexibility.