


Introduction
Most market research projects that fail do not fail in the field. They fail in the planning meeting where someone looked at the budget, named a sample size that felt right, and nobody calculated what that number actually meant for precision, feasibility, or the cost of recruiting to each quota cell. The result is fieldwork that runs over budget chasing impossible cells, findings that cannot support sub-target analysis because the cells are too small, or a final report that quietly acknowledges the sample “skewed younger” without explaining what that does to the conclusions.
The tool that prevents all three of those outcomes exists and in 2026, it is free. H-in-Q’s Sample Structure & Quotas Simulator is a purpose-built quota planning tool that takes your research objective, quota method, precision target, and margin of error, and generates three complete sample scenarios; proportional, equal cells, and custom instantly. Before a single screener is written, before a panel is contacted, before a budget is signed off, you can see exactly how many total interviews your design requires and where your fragmentation risk lies.
This guide explains how to use the tool, what each scenario means in practice, when to choose cross quotas over simple quotas, and how to read the fragmentation warning that saves research programs from the single most common quota design error in the industry. H-in-Q’s market research team built this tool from direct fieldwork experience across US and MENA markets. Every feature solves a real problem that real research programs encounter before the first interview is conducted.
What Is a Survey Quota Planning Tool and Why Every Researcher Needs One Before Fieldwork
A survey quota planning tool is software that calculates how many interviews a market research study needs across each audience segment, given a defined precision target and margin of error before fieldwork begins. It translates research objectives into concrete sample requirements: not just a total number, but a cell-by-cell breakdown that reveals whether the design is feasible, how much it will cost to field, and where the precision breaks down.
Most research teams plan quotas using one of three inadequate approaches: copying sample sizes from previous studies regardless of whether the objectives match, using a generic sample size calculator that produces a total without any quota structure, or working backward from budget to sample size without checking whether the resulting cells are large enough to support the analysis they need. All three produce the same downstream problem; a sample design that looks reasonable on paper and fails in the field.
The Sample Structure & Quotas Simulator from H-in-Q solves this at the planning stage, where fixing it costs nothing. Fixing a quota design problem mid-fieldwork costs the equivalent of restarting the study.
The tool is free. It requires no account, no subscription, and no research methodology expertise to operate. It produces three complete sample scenarios in seconds, with a built-in fragmentation warning that flags designs likely to cause fieldwork problems before a single invitation is sent. Access it directly at sample-quota-simulator.
The Pre-Fieldwork Problem: Why Sample Design Goes Wrong Before Research Begins
Understanding what the tool fixes requires understanding the sequence of decisions that produce bad sample designs. The errors are consistent and predictable, and they occur at the planning stage, not the fieldwork stage.
Error 1: Choosing a sample size before choosing a quota structure
Most researchers start with a budget, derive a sample size from that budget, and then design their quota structure around the number they have already committed to. The correct sequence is the reverse: design the quota structure first, calculate the minimum sample the structure requires for the precision level you need, and then present that number to the budget owner with a clear explanation of what each scenario costs and what precision it delivers.
When the sequence is reversed, the most common outcome is a study with a quota design that requires 600 interviews for sub-target precision but a budget that funds 300, and nobody realizes the mismatch until fieldwork is underway and the cells are filling unevenly.
Error 2: Cross-interlocking too many variables
Crossing multiple quota variables multiplies the number of cells your fieldwork must fill. Three age bands crossed with two genders and three income levels produces 18 cells. At a practical minimum of 30 respondents per cell, the total sample cannot fall below 540; regardless of what the budget allocated. Add a regional split across four US regions, and you have 72 cells requiring a minimum of 2,160 interviews. At this scale, some cells become nearly impossible to fill; recruiters spend the last weeks of fieldwork hunting for young high-income rural males who are virtually absent from most online panels.
Over-interlocking quotas is the single most common cause of fieldwork failure in market research, and it is entirely detectable before fieldwork begins if the researcher calculates cell count against minimum cell size at the planning stage.
Error 3: Conflating global precision with sub-target precision
A study designed for a ±5% margin of error at the global total level requires 384 interviews. The same study designed for ±5% precision at each sub-target level, so that each quota cell can be read independently, requires 384 interviews multiplied by the number of cells. These are fundamentally different research designs with fundamentally different sample sizes and costs, and they are regularly confused in research briefs that specify “representative sample, n=400” without stating which level of precision that 400 is designed to deliver.
The Sample Structure & Quotas Simulator makes this distinction explicit by requiring researchers to choose their precision target before the scenarios are generated; forcing the decision that most research briefs leave ambiguous.
How the Sample Structure & Quotas Simulator Works: A Complete Walkthrough
The tool has two input zones and one output zone. The entire workflow takes under five minutes for a standard study design.
Zone 1: Input Configuration
Step 1: Select your quota method
The tool offers two quota methods:
Cross quotas (interlocked cells): Variables are crossed, and every combination becomes its own cell with its own recruitment target. A study crossing gender (2 categories) with age (3 bands) produces 6 cells, each of which must be filled independently. Cross quotas produce the most precisely representative samples because they control the joint distribution of variables, not just their marginal totals. They require larger total samples and are more difficult and expensive to field.
Simple quotas (marginal, up to 5 variables): Each variable has its own separate target, with no requirement about how variables combine. You might require 50% women and 40% aged 25–34, but the tool does not require that any specific proportion of women are in the 25–34 band. Simple quotas are faster and cheaper to field because you are recruiting to marginal targets rather than cell-level targets. They produce less precise joint distributions; the sample could legally end up with all young respondents being women and all older respondents being men.
When to choose cross quotas? When your analysis requires reliable sub-group comparisons. for example, when you need to compare the opinions of young women versus older men separately. When the joint distribution of your variables matters to the research conclusions. When your study requires reporting at the intersection level.
When to choose simple quotas? When your primary read is at the total level, with sub-group analysis secondary. When budget and timeline are constrained and the research objective does not require cell-level precision. When you have more than 3–4 quota variables; interlocking 5 variables creates exponentially more cells than most fieldwork budgets can fill.
Step 2: Select your precision target
Per sub-target (each cell / class readable): The margin of error you specify applies to each individual quota cell. This means every segment can be reported independently with confidence. It requires significantly larger total samples because the minimum cell size must be achieved across every cell, not just the total.
Global sample only (total-level reading): The margin of error applies to the full sample total. Sub-groups can be described directionally but cannot be reported with the same statistical confidence as the overall total. This is appropriate for studies where the primary deliverable is a total-level read, and sub-group analysis is exploratory rather than conclusive.
Step 3: Define your quota variables
Enter the variables you intend to control; gender, age band, region, income bracket, category usage, or any other characteristic relevant to your research objective. The tool accommodates up to 5 variables for simple quotas. For cross quotas, it calculates the total cell count from the variable combination you specify and triggers the fragmentation warning if that count exceeds 8 cells.
Step 4: Set your margin of error
Enter the margin of error percentage your study requires. Standard market research uses ±5% for most consumer studies. More precise studies particularly those informing significant product or positioning investments; target ±3%, which roughly quadruples the sample requirement. Studies where directional insight is sufficient use ±7–10%, which significantly reduces minimum sample size.
The tool applies this margin of error to whichever precision target you selected in Step 2; per cell for sub-target precision, or to the global total for total-level precision.
Step 5: Generate plan and scenarios
Click Generate; the tool instantly produces Zone 2 output.
Zone 2: Recap – Key Figures and Three Scenarios
The output zone delivers two critical pieces of information: the fragmentation risk warning (if triggered) and the total interviews required across three complete scenarios.
The Fragmentation Risk Warning
When your cross-quota design produces more than 8 interlocked cells, the tool displays an explicit warning:
“Sample fragmentation risk: cross-quota cells (more than 8). Recruiting and controlling many small cells is slow and expensive, and tiny cells make results unstable. Consider dropping a variable, merging classes, or switching to simple quotas.”
This warning is the most valuable output in the entire tool for experienced researchers; because it flags, before any fieldwork commitment, that the current design is likely to produce either runaway costs from slow cell recruitment or statistically unstable findings from cells too small to analyze. A study that ignores the fragmentation of warning and proceeds to fieldwork with 12+ interlocked cells is betting the research budget on finding respondents who fit rare demographic combinations at acceptable panel incidence rates. Most do not.
The fix the tool recommends covers the three practical responses: drop a variable (reduce total cell count), merge classes within a variable (convert a 4-band age split into a 2-band split), or switch to simple quotas (eliminate cell intersection requirements entirely).
The Three Scenarios
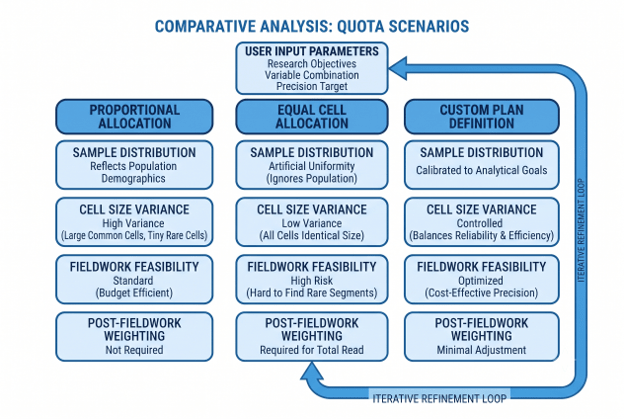
The tool generates three complete sample plans simultaneously, allowing direct comparison of the total interview requirements and structural implications of each approach:
S1 · Proportional The proportional scenario allocates interviews across cells in proportion to their representation in the target population. If women aged 18–34 represent 22% of your target population, they receive 22% of the total sample. This produces the most representative overall sample in terms of population demographics but creates very unequal cell sizes; large cells for common demographic combinations, tiny cells for rare ones. Proportional designs are appropriate when the primary deliverable is a total-level read that mirrors population reality. They are problematic when sub-group analysis requires reliable reporting across all segments, because rare segments will be represented by too few interviews to report with confidence.
S2 · Equal cells The equal cells scenario allocates the same number of interviews to every cell regardless of its population proportion. If your design has 6 cells, each receives an identical target; the total sample divides evenly across all segments. This over-represents rare segments relative to the population and under-represents common ones but ensures that every cell has enough interviews for reliable independent analysis. Equal cell designs require weighting the data before reporting total-level results, because the artificial equal distribution does not reflect reality. They are appropriate when the research objective requires segment-level comparison with equal statistical confidence across all groups.
S3 · Custom plan The custom scenario allows the researcher to define their own cell-level allocations; neither fully proportional nor fully equal but calibrated to the specific analytical priorities of the study. Common custom approaches include minimum cell size guarantees (every cell gets at least 80 interviews, regardless of population proportion, with remaining interviews distributed proportionally), boosted sub-groups (a priority segment receives additional interviews beyond its proportional allocation), or hybrid designs (proportional allocation within geographic regions, equal allocation across age bands).
The comparison across all three scenarios in a single view is the tool’s most commercially valuable output. It shows researchers, before any fieldwork commitment, that:
- The proportional design requires 420 total interviews but produces 3 cells with fewer than 30 respondents
- The equal cells design requires 600 total interviews, and all cells are statistically reliable but requires post-fieldwork weighting
- The custom design at minimum 80 per cell requires 510 interviews, balances reliability and efficiency, and requires minimal weighting adjustment
That comparison, which previously required manual spreadsheet calculation, now takes five minutes.
Cross Quotas vs. Simple Quotas: How to Choose Before You Open the Tool
The most consequential decision in the entire quota planning process is whether to use cross quotas or simple quotas, and it should be made before you open any tool, based on your research objective.
Use Cross Quotas When:
Your analysis requires sub-group intersections. If your research findings will include statements like “young women respond differently than older men to this positioning,” you need cross quotas; because only interlocked cells guarantee that both age and gender are controlled simultaneously within each cell, not just marginally.
The joint distribution of your variables affects your conclusions. A study on technology adoption that controls age and income separately (simple quotas) could end up with all high-income respondents being older, systematically confounding two variables that have different relationships with technology adoption. Cross quotas prevent this by controlling the joint distribution.
Your study has 2–3 quota variables and a sufficient budget. Cross quotas are feasible and highly defensible for studies with 2 variables (4–6 cells) or 3 variables with limited categories (6–8 cells). Beyond 8 cells, the fragmentation risk that the tool flags becomes a genuine operational constraint.
Use Simple Quotas When:
Your primary deliverable is a total-level read. If the study’s main output is an overall brand awareness figure, a net promoter score, or a total-level attitude measure; with sub-group analysis treated as directional context rather than reportable findings, simple quotas deliver the representativeness you need at significantly lower cost and recruitment complexity.
You have 4–5 quota variables. Interlocking 5 variables creates a minimum of 32 cells (for binary variables) and more typically 50–100+ cells when real-world variable categories are applied. At this scale, simple quotas are the only operationally feasible choice for most research budgets.
Your timeline is compressed. Simple quotas fill faster in fieldwork because recruiters are matching respondents to marginal targets rather than specific cell intersections. When a hard fieldwork deadline exists, simple quotas reduce the risk of closing with unfilled cells.
How AI Is Changing Sample Planning for US Market Researchers in 2026
The pre-fieldwork planning phase of market research, historically the domain of experienced methodologists with Excel spreadsheets and institutional knowledge; is being transformed by purpose-built AI tools that make rigorous sample design accessible to any researcher, regardless of seniority or methodology background.
Three structural changes are driving this transformation. First, the democratization of research means more US marketing and product teams are running studies without a dedicated research methodologist, and they need tools that encode methodological best practices rather than assuming prior knowledge. Second, the proliferation of research platforms means there are more choices about how to field a study, making pre-fieldwork planning more important, not less, because the wrong quota design produces the wrong data regardless of which platform delivers it. Third, the cost pressure on research budgets means that every efficiency in sample design compounds directly into cost savings; a quota plan that identifies an over-complicated cross design before fieldwork saves the cost of slow cell recruitment and potential fieldwork extension.
H-in-Q’s Sample Structure & Quotas Simulator sits precisely at this intersection: methodological rigor made accessible, for free, before any fieldwork cost is committed. The three-scenario output; proportional, equal cells, custom, encodes the same trade-off analysis that a senior research methodologist would produce in a planning session, delivered in seconds to any researcher who can define their variables and margin of error requirement.
The tool connects naturally to H-in-Q’s broader market research suite. Once the sample structure is planned and the quota design is confirmed, the fieldwork itself can be executed through H-in-Q tools such as Converse-in-Q’s conversational AI survey platform for quantitative breadth. The Sample Structure & Quotas Simulator ensures that whichever fieldwork method is chosen, the sample design it operates on has been validated for precision, feasibility, and budget before the first respondent is contacted.
5 Quota Design Rules the Sample Structure & Quotas Simulator Enforces Automatically
The tool does not just calculate, but it encodes five research methodology principles that protect study quality.
Rule 1: Fragmentation warning at more than 8 cross-quota cells. The tool flags designs that cross the practical feasibility threshold for interlocked quota management. Eight cells is not an arbitrary number; it represents the point at which cell-level recruitment becomes operationally complex enough to generate significant fieldwork risk for most US research budgets and timelines.
Rule 2: Auto-normalization of variable weights to 100%. If the percentages you enter for a variable’s categories do not sum to exactly 100%, the tool normalizes them automatically. This prevents a common planning error where researchers define category proportions independently and create a design that is mathematically inconsistent before fieldwork begins.
Rule 3: Three scenarios generated simultaneously. Forcing the comparison of proportional, equal cells, and custom designs before fieldwork commitment prevents the most common quota planning shortcut, choosing a single approach without evaluating the alternatives. Researchers who see all three scenarios in parallel make more informed design decisions than those who calculate a single scenario and proceed.
Rule 4: Margin of error tied to precision level. The tool requires researchers to specify whether the margin of error applies to each cell or only to the total, making explicit a distinction that research briefs frequently leave ambiguous. This prevents the mismatch between what a sample was designed to deliver and what the analysis subsequently requires from it.
Rule 5: Per-scenario interview totals before commitment. Every scenario shows its total interview requirement before any fieldwork is commissioned. This means the cost implication of each design choice; proportional vs. equal, cross vs. simple, ±3% vs. ±5%; is visible at the planning stage, not after fieldwork has begun, and the budget is already committed.
Tools That Work Alongside the Sample Structure & Quotas Simulator
The Simulator addresses the pre-fieldwork planning phase. These tools address the phases that follow:
- H-in-Q Sample Structure & Quotas Simulator: Free. Plan your quota structure and compare proportional, equal cells, and custom scenarios before any fieldwork begins.
- Converse-in-Q: Conversational AI survey platform for quantitative fieldwork at scale.
- BuzzPulse-in-Q: Social listening and brand intelligence for continuous tracking alongside primary research.
- Qualtrics / SurveyMonkey: Enterprise survey platforms with built-in quota management for fieldwork execution once your sample plan is confirmed.
FAQ: The Sample Structure & Quotas Simulator and Survey Quota Planning
What is H-in-Q's Sample Structure & Quotas Simulator?
The Sample Structure & Quotas Simulator is a free market research tool from H-in-Q that helps researchers plan their sample structure and quota design before fieldwork begins. It takes your quota method (cross or simple), precision target (per sub-target or global), quota variables, and margin of error, and instantly generates three complete sample scenarios; proportional, equal cells, and custom; showing total interview requirements and flagging sample fragmentation risk for designs with more than 8 interlocked cells.
What is the difference between cross quotas and simple quotas?
Simple quotas set separate targets for each variable independently. for example, 50% women and 40% aged 25–34; without controlling how those variables combine in the sample. Cross quotas (interlocked cells) control the intersection, setting a specific target for women aged 25–34 as a distinct cell. Cross quotas produce more representative joint distributions and are required when sub-group intersection analysis is a research deliverable. Simple quotas are faster and cheaper to field and appropriate when the primary read is at the total level.
What is sample fragmentation risk and why does it matter?
Sample fragmentation risk occurs when cross-quota design creates more cells than the total sample can fill to the minimum size required for reliable analysis, typically triggered at more than 8 interlocked cells. Tiny cells under 30 respondents produce statistically unstable results, slow fieldwork as recruiters struggle to find rare demographic combinations, and pressure on screening quality as panels deplete. The Sample Structure & Quotas Simulator flags this risk automatically and recommends dropping a variable, merging categories, or switching to simple quotas.
When should I use proportional vs. equal cell quota allocation?
Use proportional allocation when your primary deliverable is a total-level read that mirrors population reality; each segment receives interviews proportional to its real-world representation. Use equal cell allocation when all segments must be reported independently with equal statistical confidence; each cell receives the same number of interviews regardless of population proportion. Equal cell designs require post-fieldwork data weighting before total-level results are reported. Most studies use a hybrid: equal cell minimums plus proportional distribution of remaining interviews.
How many interviews does a market research survey typically need?
At ±5% margin of error for a global total-level read, the standard minimum is 384 interviews. For per-cell precision across a cross-quota design, multiply your minimum cell size (typically 80–100 interviews for reliable sub-group reporting) by your total cell count. A 6-cell cross design at 80 minimum per cell requires 480 total interviews. A 12-cell design at the same minimum requires 960. The Sample Structure & Quotas Simulator calculates all three scenarios automatically for your specific variable configuration and margin of error target.
Is the Sample Structure & Quotas Simulator free to use?
Yes, H-in-Q's Sample Structure & Quotas Simulator is completely free, requires no account or subscription, and is accessible directly at h-in-q.com/sample-quota-simulator. It is part of H-in-Q's free tools suite for market research professionals, alongside other planning resources designed to support rigorous research design before fieldwork costs are committed.
Conclusion
The most expensive mistake in market research is not bad fieldwork; it is a bad sample design that produces bad fieldwork. A quota plan with too many interlocked cells stalls in field. A design that confuses global precision with sub-target precision produces findings that cannot support the analysis they were commissioned to inform. A sample size chosen from budget rather than from statistical requirements reports conclusions with margins of error nobody calculated.
All three mistakes are detectable before fieldwork begins, if the researcher runs the numbers. H-in-Q’s Sample Structure & Quotas Simulator runs those numbers in five minutes, for free, before any fieldwork cost is committed. It shows researchers the total interview requirements of proportional, equal cell, and custom designs simultaneously, auto-normalizes variable weights, and flags the fragmentation risk that quietly kills more research programs than any fieldwork problem ever does.
The precision your study delivers is set at the planning stage, not the analysis stage. Plan your sample structure before fieldwork starts → h-in-q.com/sample-quota-simulator/
The quota design that wins the boardroom presentation is built the week before fieldwork opens, not the week before the report is due.