


DIRECT ANSWER
"H-in-Q offers 7 free market research tools covering every stage of a research program: the Sample Size Calculator, Market Research Ratio Calculator, NPS Calculator, Quota Simulator, Focus Group Discussion Guide, Cross-Tab Generator, and Competitive Matrix Builder. All 7 tools are 100% free with no account required, covering market sizing, study planning, qualitative research design, data analysis, loyalty benchmarking, and competitive intelligence."
Introduction
Professional market research costs between $25,000 and $65,000 for a standard custom project in 2026, with global multi-market programs running $150,000 or more. For the 66.3% of small business owners spending less than $1,000 on marketing annually, and for the 26% of researchers who cite budget as the single biggest barrier to doing the research their business actually needs, that price tag is not a planning constraint; it is a full stop.
What has changed in 2026 is not the cost of enterprise research platforms. It is the availability of purpose-built free tools that handle the statistical, structural, and analytical work that previously required either expensive software or a trained methodologist. H-in-Q’s free tool suite covers seven distinct stages of a market research program; from market sizing before you spend a dollar, through study design, data collection, data analysis, customer loyalty benchmarking, and competitive intelligence with no account, no subscription, and no hidden cost at any stage.
This guide walks through all 7 tools in sequence, explains exactly what each one does, when to use it, and where it fits in a research workflow that produces decision-grade findings rather than educated guesses. H-in-Q’s market research team built these tools from direct implementation experience across US and MENA markets. Every tool solves a real planning or analysis problem that researchers encounter before, during, or after a study. The sequence matters as much as the tools themselves and this guide covers both.
Why the Sequence of Research Tools Matters as Much as the Tools Themselves
Before walking through each tool, one principle is worth stating clearly: free market research tools used out of sequence produce data that cannot answer the decision they were designed to inform. This is the most common failure mode in DIY research programs, and it is entirely avoidable.
The research workflow that produces reliable, decision-grade findings follows a consistent order:
Stage 1: Market sizing: Establish the size and structure of your opportunity before investing in primary research. If the market is too small or already saturated, the research question changes entirely.
Stage 2: Study planning: Calculate sample sizes and quota structures before recruiting a single respondent. The minimum sample required for statistical reliability must be confirmed before fieldwork costs are committed.
Stage 3: Data collection design: Build the qualitative and quantitative instruments; discussion guides, survey templates, that will collect the data your analysis will require.
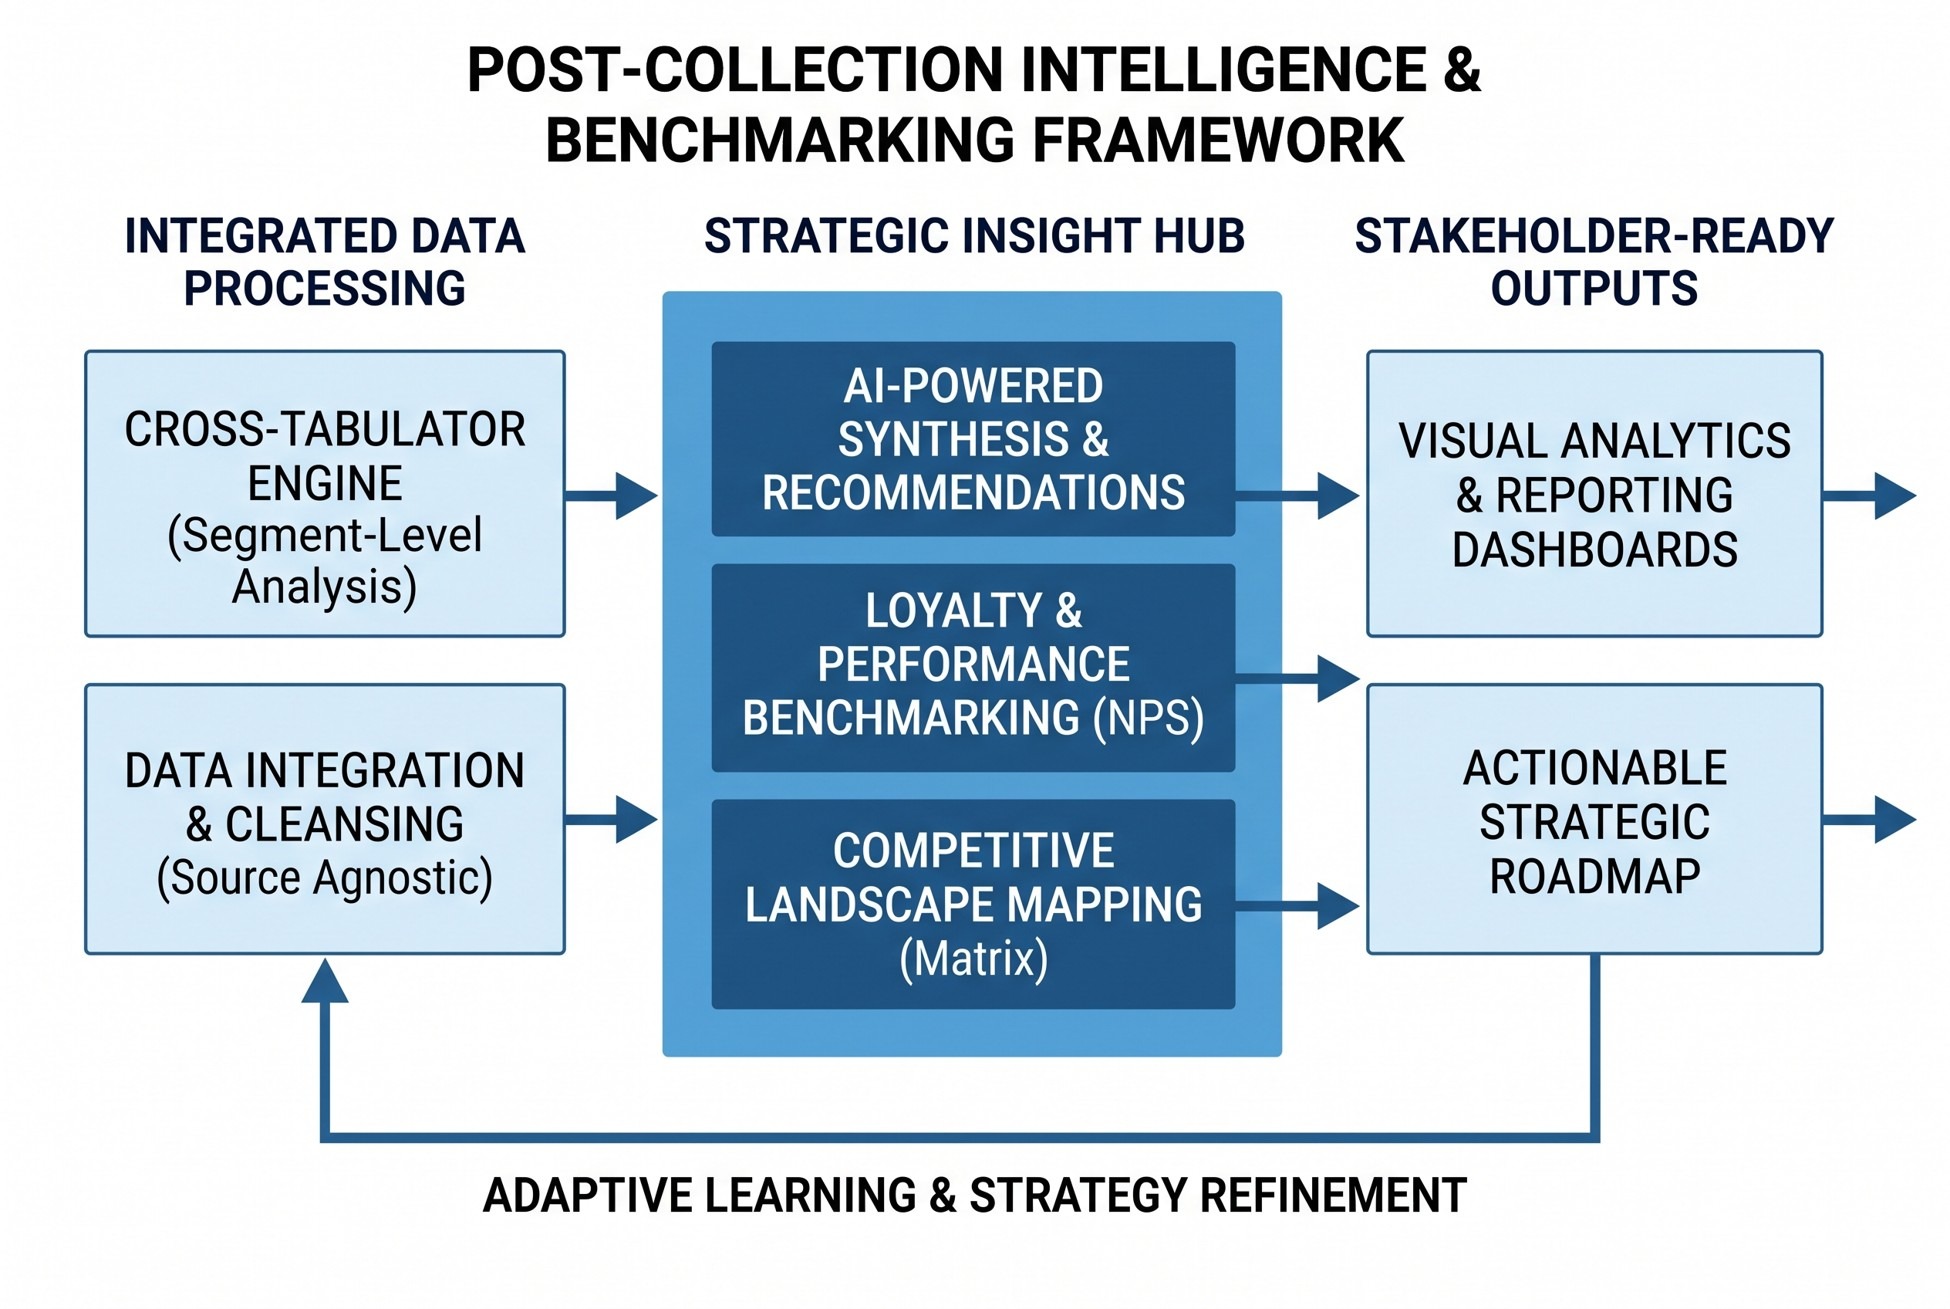
Stage 4: Data analysis: Once data is collected, cross-tabulation and segmentation tools transform raw responses into findings by audience segment, demographic group, and behavioral profile.
Stage 5: Loyalty and performance benchmarking: NPS and customer satisfaction metrics contextualize your primary findings against industry benchmarks.
Stage 6: Competitive intelligence: Structured competitor analysis, informed by your primary research findings, positions your insights in the competitive landscape.
Every tool in H-in-Q’s free suite maps to one of these stages. The following walkthrough covers each tool in workflow order; not alphabetical order, not by category, but in the sequence that produces the most reliable research output at each stage.
Tool 1: Market Research Ratio Calculator – Start With Market Sizing
What it does: Calculates the key ratios behind any market research project; TAM, SAM, SOM, CAGR, market share, competitive positioning, and financial ratios all in one free tool.
Use it at: Stage 1; before investing in any primary research, before recruiting participants, before writing a survey question.
Access it free: market-research-ratio-calculator
Market sizing is the most skipped step in most small business research programs, and skipping it produces the most expensive research mistake: investing in primary research to answer a question that market sizing would have shown was the wrong question. A product team that confirms strong consumer enthusiasm for a concept via focus groups, then discovers the total addressable market is too small to justify the launch, has spent $15,000–$30,000 learning something a 30-minute market sizing exercise would have revealed for free.
The Market Research Ratio Calculator handles the three core market sizing frameworks every US business needs before committing to research investment:
TAM / SAM / SOM: Total Addressable Market establishes the full revenue opportunity if your product captured 100% of available demand. Serviceable Addressable Market narrows to the portion your product can realistically reach given geography, price point, and positioning. Serviceable Obtainable Market sets a realistic near-term capture target based on competitive dynamics and go-to-market capacity. These three numbers, calculated together before research begins and determine whether the research objective is worth investigating and how large a sample the study needs to justify.
CAGR (Compound Annual Growth Rate): Market growth rate determines whether you are entering a growing, stable, or declining market; a context that shapes how you interpret every finding from your primary research. A 15% year-on-year growth rate in your target category changes the urgency and direction of product research conclusions completely versus a -3% declining market.
Market share and competitive positioning ratios: Current competitive share distribution tells you how consolidated or fragmented your target market is before you design a competitive study. A market dominated by one player with 70%+ share requires a different research strategy than one where the top five players each hold 15–20%.
Use the Market Research Ratio Calculator first in every research program. The numbers it produces set the research context that makes every subsequent finding interpretable. 👉 H-in-Q AI market research suite
Tool 2: Sample Size Calculator – Know Your Numbers Before You Field
What it does: Instantly calculates the minimum number of respondents for statistically reliable market research; based on your margin of error, confidence level, and response rate.
Use it at: Stage 2, after market sizing confirms your research objective, before recruiting participants or launching surveys.
Access it free: market-research-calculator
Choosing a sample size before running the numbers is the second most common research planning error, after skipping market sizing entirely. Teams that decide on n=200 because it feels reasonable, or copy the sample size from a previous study without checking whether the objectives match, consistently produce research with either more precision than they paid for or less precision than their decision requires.
The Sample Size Calculator eliminates this guesswork by computing the minimum sample required for three configurable inputs:
Margin of error: The precision range within which your findings will be accurate. The standard for most US consumer research is ±5%. More precise studies targeting specific sub-groups, or informing significant investment decisions, use ±3%; which roughly quadruples the sample requirement. Directional research where exact figures are less critical can use ±7–10%, significantly reducing cost.
Confidence level: The probability that your sample findings reflect the true population value. The industry standard is 95% confidence; meaning if you ran the same study 100 times, 95 of those studies would produce results within your margin of error. For decisions with significant financial implications, 99% confidence is warranted; for exploratory research, 90% confidence reduces sample requirements.
Response rate: The percentage of contacted respondents who will complete your survey. Realistic response rate assumptions; typically 20–40% for email surveys, 60–80% for recruited panel studies, determine how many people you need to contact to achieve your minimum completed sample.
The tool outputs the minimum sample size required to meet all three criteria simultaneously. This number determines fieldwork cost, recruitment timeline, and whether a study is feasible within your budget; calculated in seconds, before any fieldwork commitment is made.
For research programs that include focus groups alongside surveys, the Sample Size Calculator handles the quantitative component. The qualitative sample planning; participant count, group structure, and quota design is handled by the Quota Simulator below.
👉Quota Simulator guide
Tool 3: Quota Simulator – Design Your Sample Structure Before Fieldwork
What it does: Designs your sample structure and simulates cross-quotas; generating interview counts, weights, and margins of error for three complete scenarios (proportional, equal cells, and custom) instantly.
Use it at: Stage 2, alongside the Sample Size Calculator, after market sizing, before launching fieldwork.
Access it free: sample-quota-simulator
Knowing the minimum total sample your study needs is only half the pre-fieldwork calculation. The other half is knowing how that sample is structured across audience segments and whether that structure is feasible within your budget and timeline. This is what the Quota Simulator calculates.
The tool handles two quota methods:
Cross quotas (interlocked cells) Every combination of your quota variables becomes its own recruitment target. If you are crossing gender (2 categories) with age band (3 bands) and US region (4 regions), your design has 24 cells; each requiring independent recruitment. Cross quotas produce the most precisely representative samples but multiply fieldwork complexity and cost with every additional variable crossed.
Simple quotas (marginal, up to 5 variables) Each variable has its own separate target without controlling how variables combine. Faster and cheaper to field, appropriate when the primary deliverable is a total-level read rather than sub-group intersection analysis.
The Quota Simulator’s most commercially valuable output is the fragmentation warning: when a cross-quota design produces more than 8 interlocked cells, the tool flags the design as a fragmentation risk, signaling that some cells will be nearly impossible to fill at acceptable recruitment cost and timeline. This warning, delivered before fieldwork begins, prevents the most common cause of fieldwork failure in market research programs: a quota design that looked manageable on paper and became operationally impossible in field.
Three complete scenarios; proportional, equal cells, and custom. They are generated simultaneously, with total interview counts for each. The comparison lets researchers see the cost and precision implications of each approach in a single view before any fieldwork is commissioned. 👉 HiVox-in-Q for focus group fieldwork
Tool 4: Focus Group Discussion Guide – Build Your Qualitative Instrument
What it does: A structured discussion guide template for qualitative focus groups; includes icebreakers, core probing questions, a three-track deep-dive module, and closing exercises, all with timing.
Use it at: Stage 3, after sample planning is complete, when building the qualitative instrument for a focus group session.
Access it free: discussion-guide-builder
A focus group with the right participants and the wrong discussion guide produces two hours of pleasant conversation and almost no usable insight. A well-structured guide turns that same session into the clearest qualitative signal a research budget can buy; because the structure connecting the questions, the timing that protects the most important research territory, and the probes that turn surface-level answers into genuine insights are all decisions made before the moderator walks into the room.
H-in-Q’s Focus Group Discussion Guide builder takes researchers through each structural section step by step:
Warm-up (10 minutes): Low-stakes, rapport-building questions that normalize speaking in a group setting without priming participants toward your specific research hypothesis. The warm-up gets everyone talking before the session reaches the topics that actually matter.
Core discussion topics (3–4 topics, ~45 minutes): Structured to move broad-to-specific within each topic; open exploration of category attitudes before stimulus presentation, unprompted language mining before branded concepts are introduced. The tool includes three deep-dive tracks for the core module: Concept/Product Test for evaluating new concepts before development investment; Usage & Attitudes for understanding current behavior and unmet needs; and Copy Test for evaluating advertising or messaging alternatives. Researchers select the track that matches their research objective, the guide adapts accordingly.
Probes (2–3 per core question): Written alongside every core question rather than improvised in the room. Improvised probes are inconsistent across sessions; planned probes create the consistency that makes cross-session comparison meaningful. “Can you say more about that?” “What made you feel that way?” “Can you give me an example?”
Wrap-up (5 minutes): A final prioritization question “Of everything we discussed today, what matters most to you?” that functions as a validity check on the entire session and surfaces what participants actually rank as important versus what they mentioned most often.
The exported guide is timed, structured, and ready to adapt for your specific research objective. 👉Full discussion guide article
Tool 5: Cross-Tab Generator – Analyze Your Survey Data by Segment
What it does: Uploads your survey data and instantly generates cross-tabulation tables by demographic segment like age, gender, region, and custom variables.
Use it at: Stage 4, after data collection, to transform raw survey responses into segment-level findings.
Access it free: crosstab-builder
Raw survey responses are data. Cross-tabulated responses by audience segment are findings. The gap between the two is where most DIY research programs stall, because generating cross-tabulation tables manually in Excel is technically possible and operationally painful, especially for researchers without a statistical background.
Cross-tabulation (cross-tab) is the analysis technique that breaks a survey question’s total-level results into segment-level comparisons: not just “60% of respondents prefer Option A,” but “78% of women aged 25–34 prefer Option A versus 41% of men aged 45–54.” The segment-level difference is typically where the most actionable commercial insight lives, because it tells you not just what the majority thinks, but which specific audience segments hold the views that matter most for your product, positioning, or messaging decision.
The Cross-Tab Generator handles this analysis automatically:
Upload your survey data file directly to the tool. Select the demographic or behavioral variables you want to cross-tabulate against; age band, gender, region, income bracket, or any custom variable in your dataset. The tool generates complete cross-tabulation tables for every question in your survey, broken down by each selected variable, with the output formatted for direct use in a research report or stakeholder presentation.
For US research teams that run surveys through Converse-in-Q and need structured segment-level analysis of the results, the Cross-Tab Generator is the natural next step in the workflow. The tool requires no statistical software, no SPSS license, and no data science background, just the survey data file and the segment variables you care about. 👉 Converse-in-Q survey platform
Tool 6: NPS Calculator – Benchmark Your Customer Loyalty
What it does: Calculates your Net Promoter Score instantly; enter your promoter, passive, and detractor counts and benchmark against industry averages.
Use it at: Stage 5, when measuring customer loyalty, tracking brand health over time, or interpreting satisfaction data alongside primary research findings.
Access it free: nps-calculator
Net Promoter Score is the single most widely used customer loyalty metric in US business, and one of the most frequently miscalculated. NPS is not a percentage of satisfied customers. It is a specific formula: the percentage of promoters (respondents scoring 9–10) minus the percentage of detractors (respondents scoring 0–6). Passives (7–8) are excluded from the calculation entirely. The resulting score runs from -100 to +100, not 0% to 100%.
Teams that calculate NPS by averaging satisfaction scores, by including passives in the denominator, or by misclassifying the 7–8 range are producing a number that looks like NPS and means something different, making it impossible to benchmark against industry standards or track meaningful change over time.
H-in-Q’s NPS Calculator eliminates calculation error by handling the formula automatically:
Enter your promoter count, passive count, and detractor count. The tool computes your NPS score instantly, with the formula shown transparently so you can verify the calculation. Industry benchmark comparisons are included, what constitutes a good NPS varies significantly by sector. A score of +30 is above average in financial services; the same score is below average in consumer technology. Benchmarking without sector context produces NPS conclusions that are technically accurate and strategically misleading.
The NPS Calculator is the fastest tool in the suite. A researcher who has already collected satisfaction data can produce a verified, benchmarked NPS result in under two minutes, with no risk of the formula errors that distort most manually calculated NPS figures. 👉 BuzzPulse-in-Q for brand tracking
Tool 7: Competitive Matrix Builder – Position Your Findings in the Competitive Landscape
What it does: Compares your product against 3–5 competitors on the criteria that matter, spots your differentiators and gaps, and generates a guided SWOT, all without sending your data anywhere.
Use it at: Stage 6, after primary research findings are in hand, to position your competitive strengths and gaps in structured, stakeholder-ready format.
Access it free: competitive-matrix-builder-free-market-research-tool
Competitive analysis is most valuable when it is structured, specific, and informed by real research findings, not when it is a collection of screenshots from competitor websites assembled the afternoon before a presentation. The Competitive Matrix Builder provides the structure that turns raw competitive intelligence into a decision-ready analysis.
The tool handles three outputs that most researchers produce separately and often inconsistently:
Feature and criteria matrix: Compare your product or service against 3–5 competitors across the dimensions that actually matter for your research question, not a generic feature checklist, but the specific criteria your primary research identified as purchase drivers. The matrix makes differentiators and gaps visible at a glance, in a format that stakeholders can read and act on without additional explanation.
Competitive positioning map: Plot where your offering sits relative to competitors on the two dimensions most relevant to your market; price and quality, breadth and depth, ease of use and power, or whatever axes your research identified as the primary decision framework for buyers in your category.
Guided SWOT analysis: The tool generates a structured SWOT (Strengths, Weaknesses, Opportunities, Threats) from the matrix inputs; turning your competitive comparison into a strategic framework that connects directly to recommendations. The SWOT is not a blank template; it is populated from the criteria and ratings you have entered, ensuring the strategic conclusions are grounded in the competitive data rather than assembled by general inference.
All analysis runs locally in the tool, no data is sent anywhere. For research teams working with competitive intelligence that is commercially sensitive, this is a critical feature. The Competitive Matrix Builder produces stakeholder-ready output from the data you enter, without that data leaving your browser session.
The Competitive Matrix Builder is the final tool in the research workflow; used to position the findings from all preceding stages in a competitive context that tells decision-makers not just what you learned, but what it means for where you stand relative to alternatives in the market. 👉 BuzzPulse-in-Q social listening
The Complete H-in-Q Free Tool Workflow: All 7 Tools in Sequence
| Research Stage | Tool | What It Produces | URL |
| 1. Market Sizing | Market Research Ratio Calculator | TAM/SAM/SOM, CAGR, market share ratios | /market-research-ratio-calculator/ |
| 2a. Sample Planning | Sample Size Calculator | Minimum respondent count by MoE and confidence | /market-research-calculator/ |
| 2b. Quota Design | Quota Simulator | 3 quota scenarios with interview counts and fragmentation warning | /sample-quota-simulator/ |
| 3. Qualitative Design | Focus Group Discussion Guide | Timed, structured discussion guide with track selection and probes | /discussion-guide-builder/ |
| 4. Data Analysis | Cross-Tab Generator | Segment-level cross-tabulation tables from uploaded survey data | /crosstab-builder/ |
| 5. Loyalty Benchmarking | NPS Calculator | Verified NPS score with industry benchmark comparison | /nps-calculator/ |
| 6. Competitive Intelligence | Competitive Matrix Builder | Feature matrix, positioning map, and guided SWOT | /competitive-matrix-builder-free-market-research-tool-h-in-q/ |
Coming soon! Survey Template Builder: Ready-to-use survey templates for brand tracking, customer satisfaction, and concept testing. Fully editable and free to download. The Survey Template Builder will complete the data collection stage of the workflow, sitting between the Focus Group Discussion Guide (qualitative) and the Cross-Tab Generator (analysis).
How AI Is Changing Free Market Research Tools in 2026
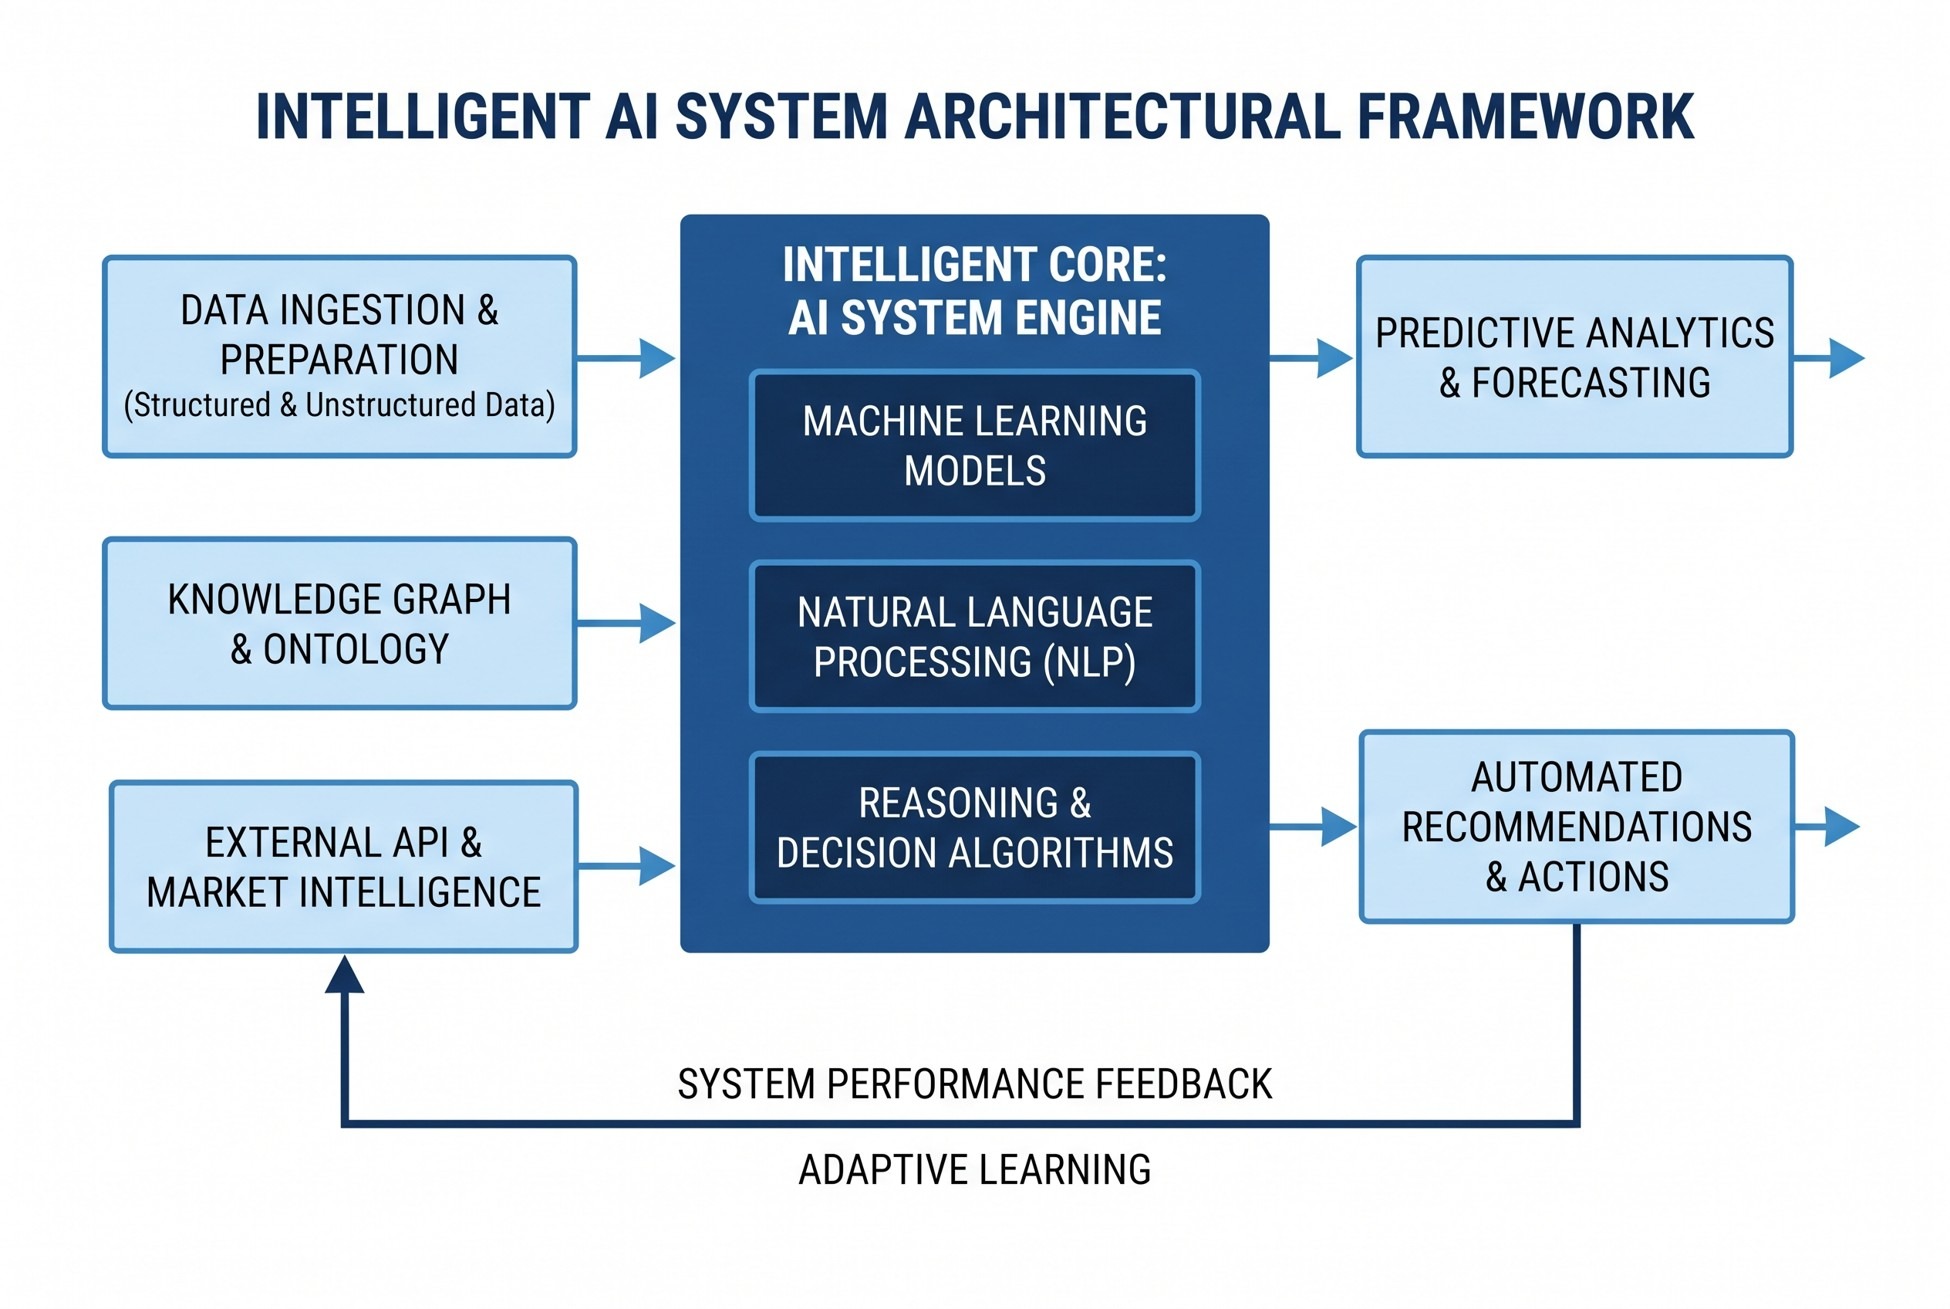
The most significant shift in the free research tools landscape in 2026 is not the emergence of new tools, it is the integration of AI into the workflow layer that sits between tools. 73% of brand-side analytics professionals now use agentic AI to prepare and integrate data, and 71% use AI to create and update reports and dashboards. Free tools that previously produced static outputs are being augmented with AI-generated interpretation, automated synthesis, and natural-language recommendations.
H-in-Q’s free tool suite is designed for exactly this integration. The statistical outputs from the Sample Size Calculator, Quota Simulator, and NPS Calculator provide the data rigor that makes AI-generated synthesis reliable, grounding AI interpretation in verified numbers rather than allowing AI to substitute for the mathematical foundation that statistical research requires. AI tools are most valuable when they synthesize findings from rigorously designed research. They are least reliable when they are used to substitute for the research design itself.
The complete research workflow; H-in-Q’s free tools for planning, design, and analysis, combined with HiVox-in-Q for AI-assisted community focus groups and Converse-in-Q for conversational surveys, gives US research teams an end-to-end research capability that previously required enterprise software budgets and specialist research staff. 👉HiVox-in-Q community AI focus groups
FAQ
Are all 7 H-in-Q market research tools actually free?
Yes, all 7 active tools in H-in-Q's free toolkit are 100% free to use with no account required, no subscription, and no hidden cost. The tools available now are the Sample Size Calculator, Market Research Ratio Calculator, NPS Calculator, Quota Simulator, Focus Group Discussion Guide, Cross-Tab Generator, and Competitive Matrix Builder. A Survey Template Builder is coming soon and will also be free when launched.
What is the difference between the Sample Size Calculator and the Quota Simulator?
The Sample Size Calculator tells you the minimum total number of respondents your study needs for statistical reliability, based on your margin of error, confidence level, and response rate. The Quota Simulator tells you how to structure that total across audience segments, comparing three quota allocation scenarios (proportional, equal cells, and custom) and warning you if your quota design creates fragmentation risk. Both tools are used in Stage 2 of the research workflow, before any fieldwork begins.
What is the Cross-Tab Generator used for?
The Cross-Tab Generator transforms raw survey response data into segment-level cross-tabulation tables, breaking total-level findings down by demographic or behavioral variables like age, gender, region, or income bracket. It is used in Stage 4 of the research workflow, after data collection, to produce the segment-level comparisons where the most actionable research insights typically live. It requires no statistical software or data science background to use.
How does H-in-Q's NPS Calculator differ from manual NPS calculation?
H-in-Q's NPS Calculator eliminates the formula errors that distort most manually calculated NPS figures, applying the correct calculation (% promoters minus % detractors, with passives excluded) automatically, and adding industry benchmark comparisons so results can be contextualized by sector. NPS benchmarks vary significantly by industry; the calculator provides 2026 sector averages so your score can be interpreted accurately rather than against a generic benchmark.
In what order should I use H-in-Q's free tools?
Use the tools in workflow sequence for maximum research quality: Market Research Ratio Calculator first (market sizing), then Sample Size Calculator and Quota Simulator (study design), then Focus Group Discussion Guide (qualitative instrument), then Cross-Tab Generator (data analysis), then NPS Calculator (loyalty benchmarking), then Competitive Matrix Builder (competitive positioning). Tools used out of sequence produce data that cannot reliably answer the research question at that stage.
Does the Competitive Matrix Builder send my data to any external server?
No, the Competitive Matrix Builder runs all analysis locally in the tool. No data is sent to any external server during the analysis process. This makes it appropriate for research teams working with commercially sensitive competitive intelligence that should not leave their browser session. The tool produces the feature matrix, positioning map, and SWOT output entirely from data entered in your session.
Conclusion
The cost of professional market research has not changed. Custom projects still run $25,000–$65,000. The cost of doing the statistical, structural, and analytical work that makes research reliable has changed to zero, with the right toolkit.
H-in-Q’s 7 free market research tools cover every stage of a research program that produces decision-grade findings: market sizing before you commit budget, sample planning before you recruit participants, qualitative instrument design before you run a session, segment-level data analysis after data collection, loyalty benchmarking against industry standards, and competitive intelligence positioned in a structured, stakeholder-ready format. Every tool is purpose-built for research workflows, not adapted from general-purpose software. Every tool is free with no account required.
The sequence matters as much as the tools. Start with market sizing, confirm your sample before fieldwork, build your instruments before data collection, analyze by segment before drawing conclusions, and benchmark against competitive context before presenting findings. Used in that order, the 7 tools produce research output that competes with studies costing 50 times more, because the methodology is sound regardless of the tool’s price. Access all 7 free market research tools →
Better research starts before the first question is written. Start with the right tools, in the right order, and the findings take care of themselves.