
The market research industry is treating synthetic data as a question with a binary answer: does it work or doesn’t it? The more productive question is narrower and more precise: under what conditions does it produce knowledge versus the appearance of knowledge?
This distinction matters operationally because a fraudulent synthetic data study and a rigorous one can look identical in their presentation. The same professional report format, the same visualizations, and the same statistical tables. The difference between them is not visible in the deliverable. It lives in the relationship between what the synthetic data is claiming to do and whether the underlying data actually supports that claim.
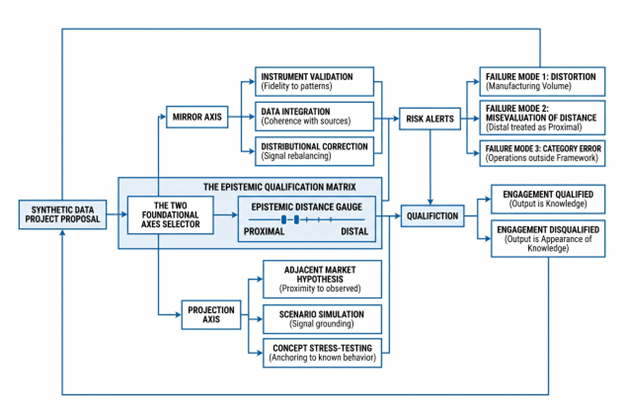
The framework presented here identifies two foundational axes; Mirror and Projection, that organize all legitimate uses of synthetic data in market research. Six specific research positions operate within these axes. Each position has explicit validity conditions. Three failure modes account for every case where synthetic data produces output that is statistically coherent but epistemically invalid. The framework is not a defense of synthetic data nor a critique. It is a test of qualification: an engagement either passes or it does not.
View h-in-q’s smart AI market research solutions
The Two Foundational Axes: Mirror and Projection
All legitimate applications of synthetic data in market research involve one of two fundamental epistemic operations.
Mirror encompasses all uses where synthetic data reflects what is already known about a population or market; applying that knowledge to test an instrument, integrate partial datasets, or correct a structural imbalance. The value is not novelty. It is controlled application of existing knowledge to reveal what that knowledge already implies.
Projection encompasses all uses where synthetic data extends what is known about a population or market toward adjacent territory that has not yet been directly observed, generating hypotheses about how that population might respond to new conditions, new concepts, or new market structures. The value is not a demand forecast. It is a structured hypothesis anchored in real data, to be tested and validated before it enters a business decision.
The distinction between them is categorical and operationally important. A Mirror operation succeeds or fails based on its fidelity to the source data. A Projection operation succeeds or fails based on its proximity to the source data; how close the unobserved territory is to the observed territory from which it is being extrapolated.
Six Research Positions: Mapping the Axes
Within these two axes, research practice has documented six distinct positions where synthetic data is legitimately applied in market research. The list that follows is not exhaustive; other positions may exist depending on research context, data structure, and analytical objectives, but these six represent the most common and well-characterized applications.
MIRROR AXIS
Position 1: Instrument Validation – Stress Testing Survey Logic Before Fieldwork
Before a survey instrument is deployed with real respondents, running synthetic populations through it exposes failure modes invisible on paper. Skip-pattern loops that strand respondents in dead ends. Response to scale fatigue at specific question depths. Section sequencing that creates cognitive interference. Filter logic that excludes intended segments.
This is the lowest-risk synthetic data application because the entire value proposition is negative: the goal is not to discover what respondents think, but to prevent the instrument from failing when it encounters what respondents actually think.
A financial services research program testing a new questionnaire on investment decision-making runs 500 synthetic respondents through the draft survey before ethics review. The synthetic run surfaces a routing failure in Section 4 that would have invalidated the comparative analysis between risk-averse and risk-tolerant segments. Catching that failure with synthetic respondents costs almost nothing. Catching it after 800 real investor interviews would require a full redesign.
The validity condition for this position is precision: the synthetic population must behave consistently with documented patterns in the target audience. Validation against held-out real data is not optional; it is how the operation proves it is doing what it claims.
Position 2: Data Integration – Fusing Partial Datasets Into Coherent Representation
Research knowledge relevant to a strategic question is frequently distributed across multiple datasets generated at different moments, by different teams, none sufficient on its own. A retailer conducting a category growth analysis might hold usage-and-attitudes data from two years prior, brand tracking from the previous quarter, and point-of-sale transaction data. Each contains genuine signal. Together, they could answer the strategic question; if the underlying populations could be reconciled into a coherent representation.
Synthetic data enables that reconciliation. By generating a unified population whose statistical properties are consistent with all source datasets simultaneously, this integration operation creates insight that no individual dataset supports alone. This is not knowledge fabrication. It is the integration of existing knowledge that was previously inaccessible because it was fragmented.
A B2B technology vendor holds three data sources: structured interviews with twelve key opinion leaders, attitudinal survey data from a panel of procurement managers, and secondary data from industry reports. The integration operation creates a coherent population consistent with all three sources simultaneously; enabling segmentation analyses that no individual source could support.
The validity condition for this position is coherence: the integrated dataset must be statistically consistent with all source datasets. Where source datasets genuinely conflict, that conflict is a finding to be reported, not a discrepancy to be resolved by the synthetic model.
Position 3: Distributional Correction – Rebalancing Sample Bias Using Real Signal
Recruitment bias is a feature of every large-scale research program. Online panels over-represent urban, educated, higher-income respondents. B2B studies over-represent large enterprises relative to the actual organization size distribution. These biases are known and documented at the time of data collection but left unaddressed because correcting them through additional real recruitment is prohibitively expensive.
Synthetic correction makes rebalancing possible where re-recruitment is not. By generating synthetic profiles for under-represented segments, drawing on real signal that exists in the source data about those segments, the distribution can be rebalanced toward the actual population structure.
A retail study with documented over-representation of affluent urban shoppers uses real data from the under-represented segments present in the sample to generate synthetic profiles that restore the distribution to actual market proportions. A manufacturing survey with low response rates from small firms generates synthetic manufacturer profiles consistent with the real small-firm respondents in the sample, rebalancing the enterprise-size distribution.
The validity condition for this position is strict: the source data must already contain genuine signal about the segments being corrected. A study can be corrected toward the actual weight of a demographic that is present in the real sample, even if under-represented. It cannot be corrected toward a demographic that the source data barely touches; that would require a different operation subject to different conditions.
PROJECTION AXIS
Position 4: Adjacent Market Hypothesis: Projecting From Known Markets Toward Nearby Markets
A consumer goods company wants to understand how pricing structures that work in the premium beer category might apply to premium cider; a category with less historical research data but adjacent consumer patterns. A financial services firm wants to model how adoption decision-making for a new workplace retirement benefit might differ from adoption patterns for existing benefits. A healthcare company wants to project primary care decision-making patterns from fee-for-service contexts toward emerging value-based payment models.
In each case, the projection anchors itself in rich behavioral or attitudinal data from a known market and extends that knowledge toward a market that is adjacent enough to the source that the training data contains genuine signal on the phenomena being modeled. The output is not a demand forecast. It is a prioritized hypothesis map; where to expect adoption, where to expect resistance, which segments are most likely to engage.
The validity condition for this position is proximity: the unobserved territory must be close enough to the observed territory that the training data contains meaningful signal. A projection from beer to cider is valid. A projection from beer to cryptocurrency is not; the consumer decision-making machinery is fundamentally different.
Position 5: Scenario Simulation: Testing Bounded Change in Complex Contexts
B2B research frequently requires understanding decision-maker responses to scenarios that have not yet occurred, or that occurred only once in the historical record. A logistics technology company models how procurement decision-makers at mid-market manufacturers would respond to a platform automating supplier switching under specific supply disruption conditions. A healthcare technology vendor simulates how hospital administrators would respond to changing reimbursement incentives. A manufacturing software company projects adoption patterns for a tool that automates production scheduling under labor-shortage scenarios.
The projection draws on extensively documented decision-making behavior under analogous pressures; supply failures, cost escalations, operational constraints, and extends that knowledge toward the specific novel scenario. The output is a map of likely response patterns, not a forecast of what will happen.
The validity condition for this position is signal grounding: the training data must contain real behavioral or attitudinal data on the decision-making mechanisms being projected, even if it does not contain data on the specific scenario. A projection based on historical procurement behavior under resource constraints is grounded. A projection from general business attitudes toward a technologically novel scenario is not.
Position 6: Concept Stress-Testing: Stress-Testing Hypothetical Products and Positioning in Synthetic Markets
Before committing fieldwork budget to a full concept test, synthetic populations can model how a defined segment might respond to a new product concept, a new brand positioning, or a new category entry. The synthetic market stress-test identifies where the concept is fragile; price rejection points, feature irrelevance, segment misalignment, cheaply and early.
A consumer packaged goods company stress-tests a new product line extension across three potential positioning angles using synthetic respondent populations built from historical product trial and brand perception data. A SaaS company tests three different value propositions with synthetic buyer personas built from existing customer segmentation and competitive positioning research. A financial services firm models how different customer segments would respond to a new account structure using synthetic populations consistent with existing behavioral and attitudinal research.
The validity condition for this position is anchoring: the synthetic population must be grounded in real data about the phenomena the concept is addressing; existing category behavior, existing brand perceptions, existing decision-making patterns, not on the concept itself, which is novel. The output is a hypothesis about where real fieldwork should focus, not a prediction of how real fieldwork will turn out.
Why These Six, and Are There Others?
The six positions outlined above represent the most documented applications of synthetic data in market research. They are well-characterized, have explicit validity conditions, and produce output that has been validated against real-world research outcomes.
Other positions may exist. A research context involving different data structures, different populations, or different analytical objectives might support other legitimate applications. This framework is not presented as exhaustive. Rather, it is a map of known territory, positions where synthetic data has demonstrated utility and where the conditions of validity are well-understood.
When a synthetic data engagement cannot be clearly identified within one of these six positions, or when it requires extending beyond the validity conditions outlined, the default position is that it requires explicit additional justification beyond the standard framework.
The Validity Anchor: Epistemic Distance
All four operations; Mirror, Synthèse, Correction, Projection, are conditioned on a single variable: how far the training data is from the population or phenomenon being modeled.
Proximal distance, the population or phenomenon modeled, is well-represented in the training data, where all six positions become valid.
Distal distance, the population or phenomenon is poorly represented or absent from the training data, is where all six positions become problematic, regardless of how statistically coherent the synthetic output appears.
The distance variable is not about demographic similarity. It is about whether the training data contains genuine signal on the mechanisms driving the behavior being modeled. A position that would be valid for a well-documented population becomes invalid for a population the training data barely touches. A projection that would be legitimate toward an adjacent market becomes illegitimate toward a distant one.
This is where the most common failure modes originate, not from the positions themselves, but from misestimating the distance between what the training data knows and what the model is being asked to generate.
Three Failure Modes: When Engagements Fail the Test
Every misuse of synthetic data in market research fails the qualification test in one of three ways.
Failure Mode 1: Distortion – Manufacturing Volume Instead of Knowledge
The most common misuse presents itself as Position 3 (Distributional Correction) but performs a different operation entirely: amplifying mathematical volume to reach a statistical threshold that the real data cannot support.
A research team collects N=40 real responses on a niche B2B segment. Someone proposes generating N=2,960 synthetic records from the same population model to reach N=3,000; achieving the statistical power required for the subgroup analysis the brief demands. The synthetic records do not add new information. They are 2,960 mathematical reflections of what the original 40 respondents said. The variance is modeled variance, bounded by the original 40. The confidence intervals narrow because the sample is formally larger. The underlying market signal is unchanged because the synthetic sample is derivative.
A cosmetics brand used this approach for a shade-range extension study. The synthetic-augmented sample showed robust purchase intent across three new shade clusters. The real N=40 behind the model was concentrated in a specific demographic subset. At launch, shade performance was sharply uneven; strong where the original 40 were representative, weak everywhere synthetic augmentation had appeared to validate. The confidence interval had narrowed. The market had told a different story.
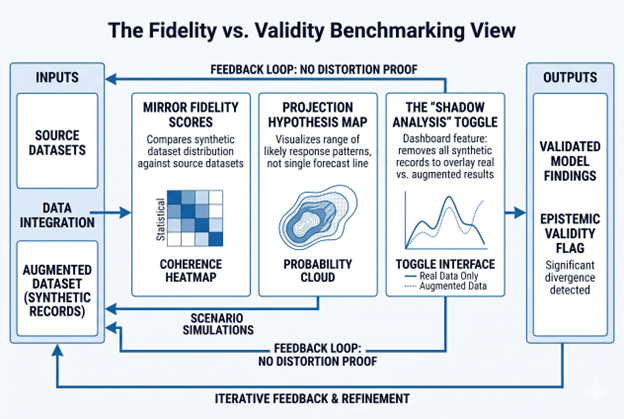
The diagnostic is simple: remove all synthetic records and analyze the real data alone. If the finding holds directionally, the augmentation was unnecessary. If it collapses, the augmentation did not solve a statistical problem; it concealed a knowledge gap.
Failure Mode 2: Misevaluation of Distance – Treating Distal as Proximal
The second failure mode is more subtle: the engagement occupies the right position, but the training data is far more distant from the target population than the analysis assumes.
A pharmaceutical firm studies treatment decision-making among oncologists in emerging markets. Real recruitment is slow. The solution: augment with synthetic physicians generated from a model trained primarily on US and European oncologist data. The synthetic oncologists pass standard validation checks. They behave consistently with what the model knows. The problem: what the model knows is what US and European oncologists operating in fundamentally different healthcare systems have said. It contains no signal on the institutional, economic, or cultural constraints that drive decision-making in the target markets.
A B2B SaaS company stress-tests a pricing model for a market segment the training data barely represents. A consumer goods firm generates synthetic respondents for a concept that has no historical analog in the training data. In each case, the operation would be valid if the distance were proximal. It becomes invalid when the distance is distal but treated as proximal.
The test for this failure mode is a single question before the engagement is commissioned: does the training data contain genuine signal on the mechanisms driving the behavior being modeled, for the population being targeted? If the honest answer is no, the engagement fails the test regardless of which position it claims to occupy.
Failure Mode 3: Category Error – Operations Outside the Framework
The third failure mode involves operations that are not on the framework at all; actions that are not Mirror, Synthèse, Correction, or Projection, and therefore not any of the six positions.
Generating synthetic personas from a large language model without a structured real-data foundation is a common instance. An LLM prompted to simulate how a target segment would respond to a brief is not performing a Mirror; it has no source structure to reflect. It is not performing a Projection; it has no proximal training data to extend. It is generating language statistically consistent with the prompt, which is a different operation from generating data statistically consistent with a population.
Demand forecasting presented as a research finding is another instance. A valid Projection generates a hypothesis map for real fieldwork to validate. The same Projection reframed as a forecast; a predicted demand curve, a revenue projection, a green-light for product launch, is a category error. The operation changed from hypothesis generation to business decision input, which changes the epistemic status of the output.
The digital twin of a specific known individual, the generation of synthetic responses to concepts with no historical precedent, the attempt to replace qualitative research with synthetic respondent interviews; these are operations that cannot be qualified within the framework because they are not epistemically valid applications of synthetic data generation.
Implications for Research Governance
Fewer than 22% of enterprise research teams have a documented policy on when to use synthetic data. That gap is where the failure modes live. A researcher without a framework reaches for synthetic data because it is fast and cheap; not because the application passes qualification.
The two axes and six positions provide the structure for a qualification process. Before any synthetic data engagement is commissioned, three questions should be answered:
Which position does this engagement occupy? If it cannot be clearly identified as one of the six; or as another position with clearly articulated validity conditions, the engagement fails before synthetic generation begins.
Is the training data proximal to the population and phenomena being modeled? Proximal means the data contains genuine signal on the mechanisms being modeled. If the honest answer is no, the engagement fails regardless of position.
What is the epistemic status of the output? Mirror outputs inform decisions within the scope of what the real data captures. Projection outputs are hypotheses for real fieldwork to test. If the intended use of the output mismatches its epistemic status, the engagement is disqualified.
Research programs applying this qualification process before commissioning will run fewer synthetic engagements. The ones they do run will produce output that withstands market contact.
Tools, Technical Notes, and Context
The six positions require different technical approaches. Tooling choices affect the validity of the operation as much as conceptual design does.
For Mirror positions (Validation, Integration, Correction), the central requirement is fidelity measurement and coherence validation. MOSTLY AI and Gretel offer configurable fidelity parameters for tabular data. Qualtrics and Ipsos document data fusion methodologies for integration at scale. The classical statistical literature on resampling and post-stratification covers correction methodologies.
For Projection positions (Adjacent Markets, Scenario Simulation, Concept Testing), the requirement is signal grounding and real-data validation. Every Projection output must be tested against real fieldwork before it enters a business decision. The EY case; where synthetic responses trained on real CEO survey data correlated at 95% with actual survey output, represents a gold standard for fidelity, not a license to replace real fieldwork.
The distinction between LLM-based generation and structured ML models trained on real data is critical: LLMs without data anchoring operate outside the framework entirely.
👉 [Internal Link: “AI market research methodology” → /blog/ai-market-research-tools]
Frequently Asked Questions
Q: What is synthetic data in market research? A: Synthetic data in market research is artificially generated data that replicates the statistical patterns of a real population without retaining any individual respondent’s actual responses. It is produced by training a generative model on real data and using that model to create new records. Its legitimate applications operate within two foundational axes, Mirror (reflecting what is known) and Projection (extending what is known toward adjacent hypotheses), and six documented positions within those axes.
Q: When should you use synthetic data for research? A: Synthetic data has legitimate research applications in the six documented positions outlined in this framework, three anchored in the Mirror axis, three in the Projection axis. Each position has explicit validity conditions tied to the proximity of the training data to the population being modeled. An engagement that cannot be clearly identified within one of these positions, or that involves populations too distant from the training data, falls outside the scope of legitimate application.
Q: What are the risks of synthetic data in consumer research? A: The three primary failure modes are: Distortion (manufacturing mathematical volume to reach statistical significance thresholds without adding market knowledge), Misevaluation of Distance (treating populations or phenomena the training data barely represents as if they are well-represented), and Category Error (performing operations that are not Mirror, Synthèse, Correction, or Projection, and therefore outside legitimate research methodology). Each produces output that can appear statistically coherent while being epistemically invalid.
Q: Can synthetic data replace real survey respondents? A: No. All six legitimate positions either draw from real respondent data (Mirror positions) or require real respondent data to validate the hypothesis (Projection positions). Synthetic data earns its methodological place by making real data collection more targeted, more efficient, and better designed, not by eliminating it.
Q: How do you know if synthetic data is valid? A: Validity is determined by three factors: which of the six positions (or other explicitly justified position) the engagement occupies, whether the training data is sufficiently proximal to the population being modeled, and whether the intended use of the output matches its epistemic status. An engagement that fails any of these three tests is invalid regardless of how statistically coherent the synthetic output appears.
Q: What is the difference between synthetic data augmentation and fraud? A: Legitimate Correction (Position 3) amplifies real signal that already exists in the source data, rebalancing a distribution toward its true population structure using evidence that was genuinely collected. Fraudulent augmentation inflates a sample to reach statistical thresholds the real data cannot support, amplifying mathematical volume rather than market knowledge. The distinction turns entirely on whether the signal being amplified is real or generated from nothing.
Conclusion
The debate about synthetic data in market research will not be resolved by better technology. Better algorithms and higher-fidelity generation do not solve the fundamental problem: the epistemic validity of the output depends on the relationship between what the training data knows and what the model is being asked to generate.
The two axes and six positions described here define where synthetic data produces knowledge rather than the appearance of knowledge. Each position has explicit validity conditions. The three failure modes account for every documented case of synthetic data misuse in commercial research. The framework does not require practitioners to be advocates or skeptics of synthetic data. It requires them to be precise about what they are claiming and whether the evidence supports that claim.
Synthetic data is a legitimate research tool for exactly two things: reflecting what is already known, and extending what is known toward what is not yet observed.
👉AI market research methodology
👉AI-powered analytics tools for MENA teams
👉BuzzPulse-in-Q for research intelligence
👉10 ways AI is changing consumer research in 2026
👉AI market research for small buisnesses
FAQ: Synthetic Data in Market Research
Synthetic Data in Market Research
What is synthetic data in market research?
Synthetic data in market research is artificially generated data that replicates the statistical patterns of a real population without retaining any individual respondent's actual responses. It is produced by training a generative model on real data and using that model to create new records. Its legitimate applications operate within two foundational axes, Mirror (reflecting what is known) and Projection (extending what is known toward adjacent hypotheses), and six documented positions within those axes.
When should you use synthetic data for research?
Synthetic data has legitimate research applications in the six documented positions outlined in this framework, three anchored in the Mirror axis, three in the Projection axis. Each position has explicit validity conditions tied to the proximity of the training data to the population being modeled. An engagement that cannot be clearly identified within one of these positions, or that involves populations too distant from the training data, falls outside the scope of legitimate application.
What are the risks of synthetic data in consumer research?
The three primary failure modes are: Distortion (manufacturing mathematical volume to reach statistical significance thresholds without adding market knowledge), Misevaluation of Distance (treating populations or phenomena the training data barely represents as if they are well-represented), and Category Error (performing operations that are not Mirror, Synthèse, Correction, or Projection, and therefore outside legitimate research methodology). Each produces output that can appear statistically coherent while being epistemically invalid.
Can synthetic data replace real survey respondents?
No. All six legitimate positions either draw from real respondent data (Mirror positions) or require real respondent data to validate the hypothesis (Projection positions). Synthetic data earns its methodological place by making real data collection more targeted, more efficient, and better designed, not by eliminating it.
How do you know if synthetic data is valid?
Validity is determined by three factors: which of the six positions (or other explicitly justified position) the engagement occupies, whether the training data is sufficiently proximal to the population being modeled, and whether the intended use of the output matches its epistemic status. An engagement that fails any of these three tests is invalid regardless of how statistically coherent the synthetic output appears.
What is the difference between synthetic data augmentation and fraud?
Legitimate Correction (Position 3) amplifies real signal that already exists in the source data, rebalancing a distribution toward its true population structure using evidence that was genuinely collected. Fraudulent augmentation inflates a sample to reach statistical thresholds the real data cannot support, amplifying mathematical volume rather than market knowledge. The distinction turns entirely on whether the signal being amplified is real or generated from nothing.
Conclusion
Synthetic data is not a single tool; it is a spectrum of techniques with radically different validity profiles depending on where and how you deploy them. The sliding scale framework offers a practical decision logic: Evangelist for pre-flight design, Optimist for privacy-compliant portability, Hesitant for classical-vs-ML imputation choices, and a firm Rejector position on sample size inflation.
The researchers who use synthetic data well treat it as scaffolding, not structure. It builds better instruments, protects respondent privacy across borders, and surfaces breaking points before expensive fieldwork begins. It does not replace the 800 real consumers who tell you something you did not expect, because nothing does.
If your team is navigating the methodology decisions that come with integrating AI into a research workflow, where synthetic data fits, where live data is non-negotiable, and how to defend either choice to a board, that is exactly the kind of programme H-in-Q.com is built to run with you. Book your free AI research strategy session →
The market has enough studies built on manufactured confidence. Build the ones that hold up.